. 2009 Dec 18;31(6):909-20.
doi: 10.1016/j.immuni.2009.09.023. Epub 2009 Dec 10.

T cell receptor CDR3 sequence but not recognition characteristics distinguish autoreactive effector and Foxp3(+) regulatory T cells

Affiliations

T cell receptor CDR3 sequence but not recognition characteristics distinguish autoreactive effector and Foxp3(+) regulatory T cells

Xin Liu et al. Immunity. .

Abstract

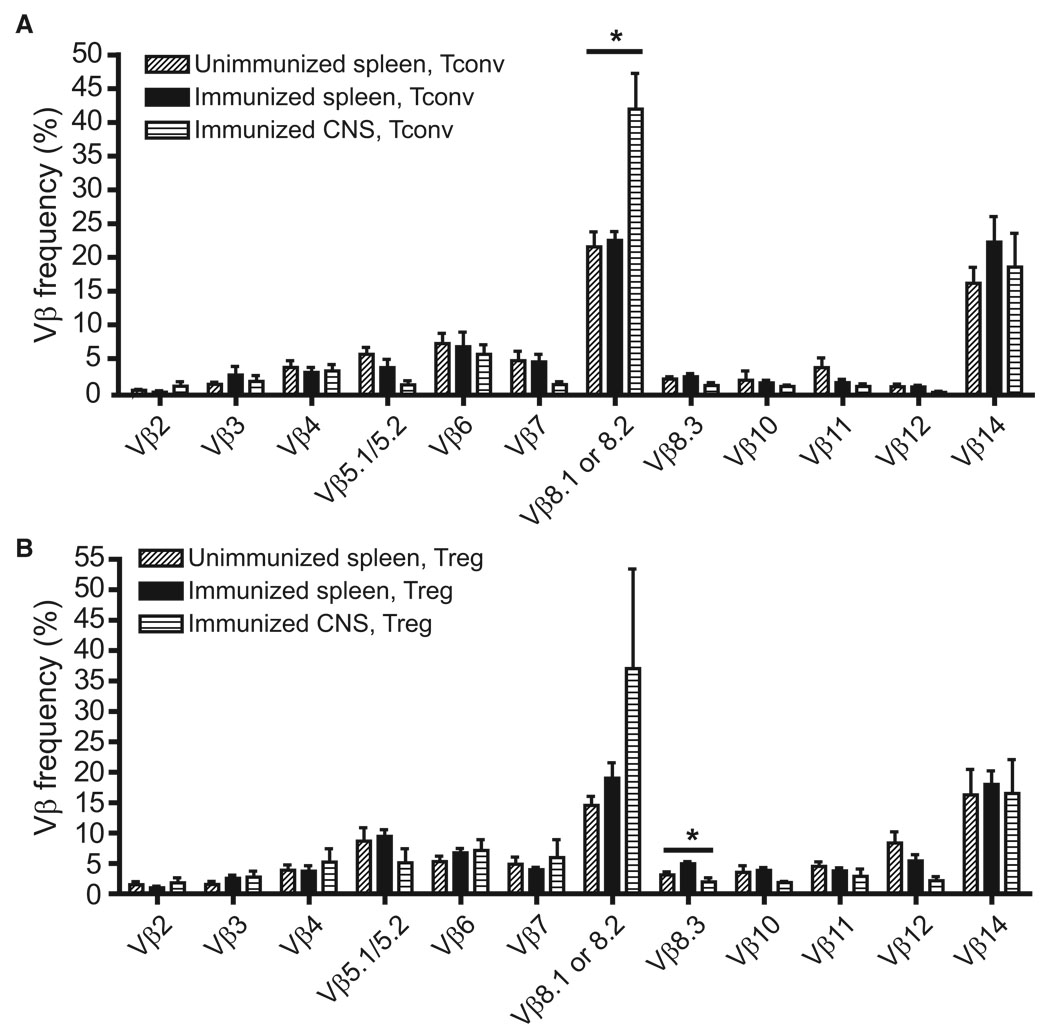
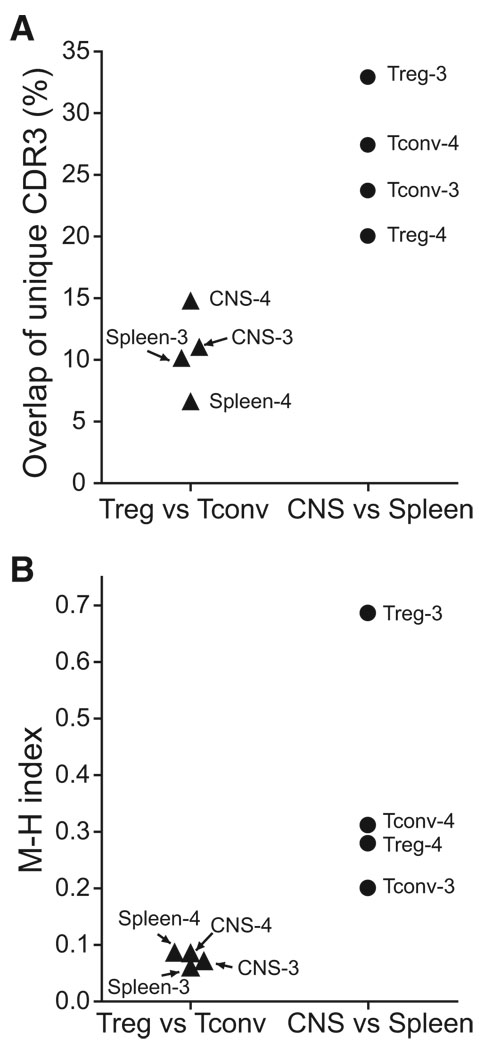
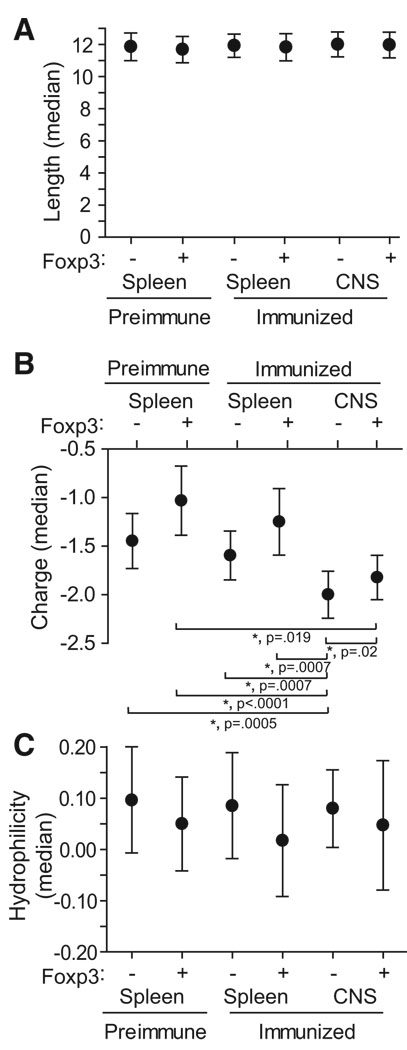
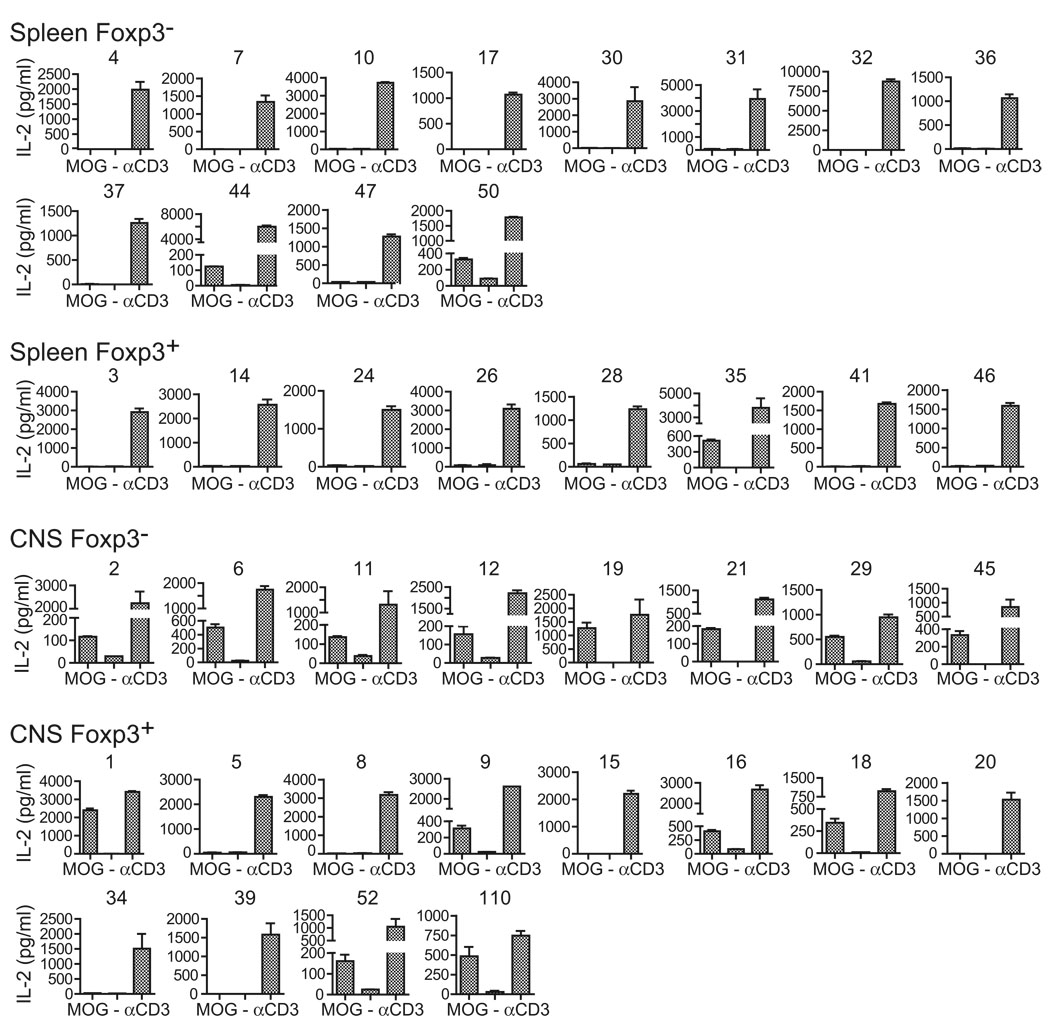
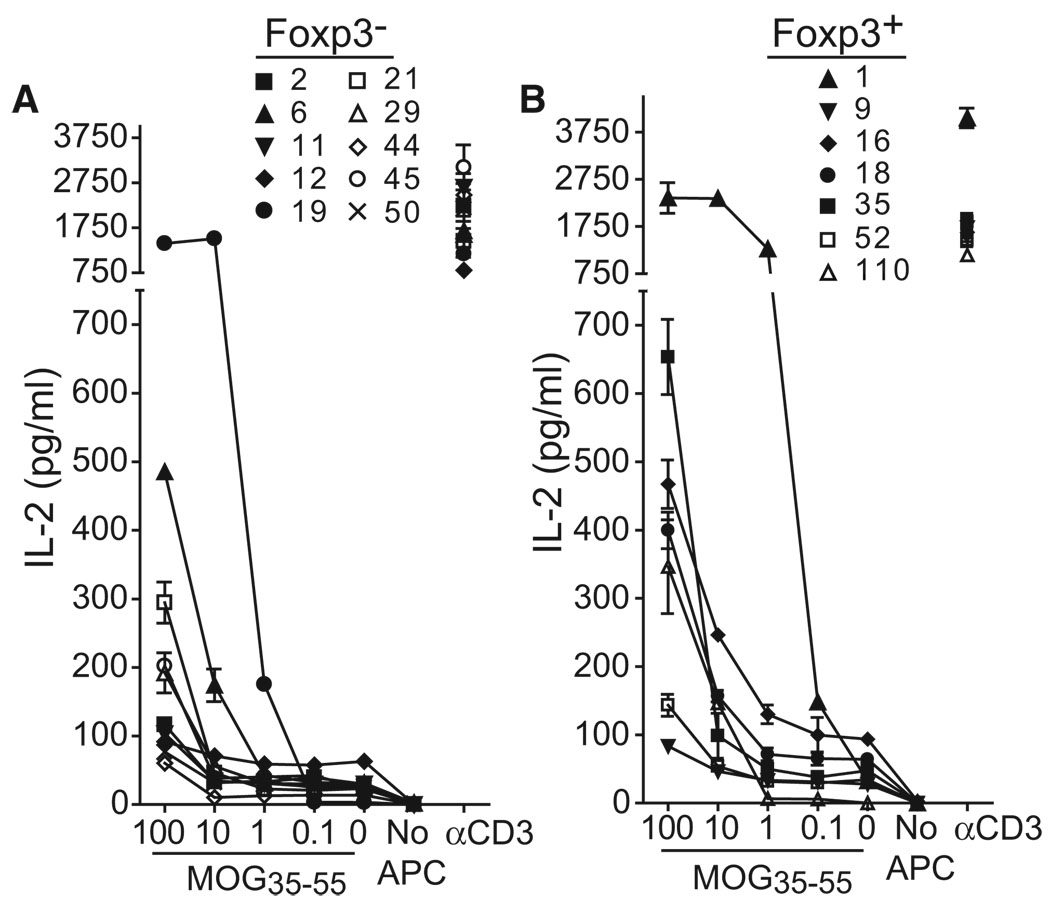
The source, specificity, and plasticity of the forkhead box transcription factor 3 (Foxp3)(+) regulatory T (Treg) and conventional T (Tconv) cell populations active at sites of autoimmune pathology are not well characterized. To evaluate this, we combined global repertoire analyses and functional assessments of isolated T cell receptors (TCR) from TCRalpha retrogenic mice with autoimmune encephalomyelitis. Treg and Tconv cell TCR repertoires were distinct, and autoantigen-specific Treg and Tconv cells were enriched in diseased tissue. Autoantigen sensitivity and fine specificity of these cells intersected, implying that differences in responsiveness were not responsible for lineage specification. Notably, autoreactive Treg and Tconv cells could be fully distinguished by an acidic versus aliphatic variation at a single TCR CDR3 residue. Our results imply that ontogenically distinct Treg and Tconv cell repertoires with convergent specificities for autoantigen respond during autoimmunity and argue against more than limited plasticity between Treg and Tconv cells during autoimmune inflammation.


Figures

Figure 1
Figure 1. Vβ Use by Retrogenic Treg and Tconv Cells
CD4+ T lymphocytes from retrogenic mice, preimmune or 22–28 days after EAE induction, were flow cytometrically analyzed with a panel of TCR Vβ-specific antibodies. Comparisons were made between Tconv (A) and Treg (B) cells from unimmunized and immunized splenocytes and CNS T cells from mice with EAE. A significant increase in Vβ8.1 or 8.2 splenocytes was seen among Tconv cells (p = 0.018), and a decrease in Vβ8.3 TCR among Treg cells (p = 0.048) when comparing pre- or immune splenic and CNS-infiltrating populations. Data show mean + 1 SEM. *p < 0.05 among group by Hochberg-adjusted 1-way ANOVA.
Figure 2
Figure 2. Population Differences among TCR Subsets in Mice with EAE
(A) Unique TCR sequences from the identified experiments (Table 1) were compared between population groups, and the frequency of sequences shared by Treg and Tconv cells within an organ (left) or of sequences from a specific cell type, Treg and Tconv cells, shared across organs (right) plotted. (B) The Morisita-Horn index, a measure of ecologic diversity among populations, is plotted for the same groups as (A). A value of 1.0 indicates population identity. Whereas (A) plots sharing of uniquely identified sequences, (B) measures differences in both sequence diversity and identification frequency between the indicated populations.
Figure 3
Figure 3. Length, Charge, and Hydrophilicity of Isolated CDR3
Medians ± 95% CI for length (A), charge (B), and hydrophilicity (C) among unique CDR3 sequences identified in the six indicated populations is plotted. Analyzed sequences were determined as the regions bounded by but not including the conserved C and F residues bordering each CDR3β. *p < 0.05 according to the Hochberg-adjusted Wilcoxon rank sum test.
Figure 4
Figure 4. MOG Specificity among Isolated TCR
Forty CDR3β, distributed among Foxp3+ and Foxp3 isolates from the CNS or spleen, were used to construct retrovirus incorporating full-length αβ TCR. Retrovirally transduced 4G4.CD4 T cells were flow cytometrically sorted for similar surface expression of TCR and stimulated with Tcra−/− splenic APC with or without 100 µg/ml MOG35–55 peptide or with plate-bound CD3 antibody. IL-2 production was measured in cell-free supernatant at 24 hr by ELISA. Data indicate mean +1 SEM and are representative of three or more assays for each TCR.
Figure 5
Figure 5. Sensitivity of MOG35–55-Specific TCR for Autoantigen
Cells bearing the indicated Foxp3 (A) or Foxp3+ (B) T cell-derived TCR were analyzed as in Figure 3 but stimulated with varied doses of MOG35–55 peptide. All cell lines were simultaneously analyzed for comparability. Data show mean ± SEM and are representative of three independent experiments with at least two independent transductions of each TCR.

Similar articles

Cited by

References

    1. Aifantis I, Mandal M, Sawai K, Ferrando A, Vilimas T. Regulation of T-cell progenitor survival and cell-cycle entry by the pre-T-cell receptor. Immunol. Rev. 2006;209:159–169. - PubMed
    1. Alli R, Nguyen P, Geiger TL. Retrogenic modeling of experimental allergic encephalomyelitis associates T cell frequency but not TCR functional affinity with pathogenicity. J. Immunol. 2008;181:136–145. - PMC - PubMed
    1. Andersson J, Stefanova I, Stephens GL, Shevach EM. CD4+CD25+ regulatory T cells are activated in vivo by recognition of self. Int. Immunol. 2007;19:557–566. - PubMed
    1. Bailey SL, Schreiner B, McMahon EJ, Miller SD. CNS myeloid DCs presenting endogenous myelin peptides ‘preferentially’ polarize CD4+ T(H)−17 cells in relapsing EAE. Nat. Immunol. 2007;8:172–180. - PubMed
    1. Bautista JL, Lio CW, Lathrop SK, Forbush K, Liang Y, Luo J, Rudensky AY, Hsieh CS. Intraclonal competition limits the fate determination of regulatory T cells in the thymus. Nat. Immunol. 2009;10:610–617. - PMC - PubMed

Publication types

MeSH terms