

Up-regulated proteins in the fluid bathing the tumour cell microenvironment as potential serological markers for early detection of cancer of the breast
- PMID: 20005186
- PMCID: PMC5527961
- DOI: 10.1016/j.molonc.2009.11.003
Up-regulated proteins in the fluid bathing the tumour cell microenvironment as potential serological markers for early detection of cancer of the breast
Abstract
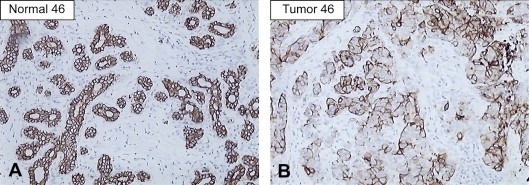
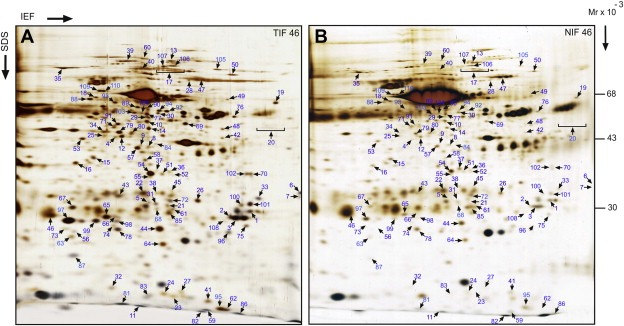
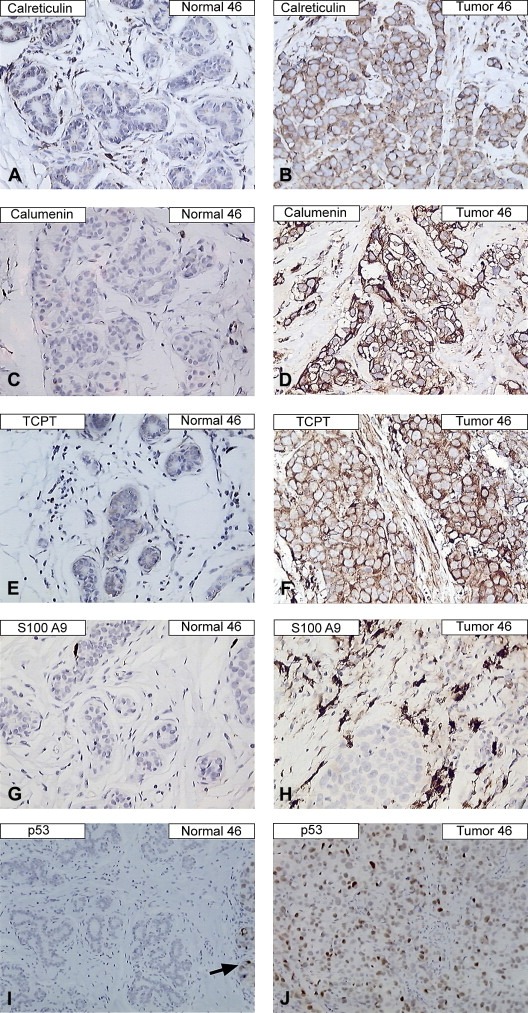
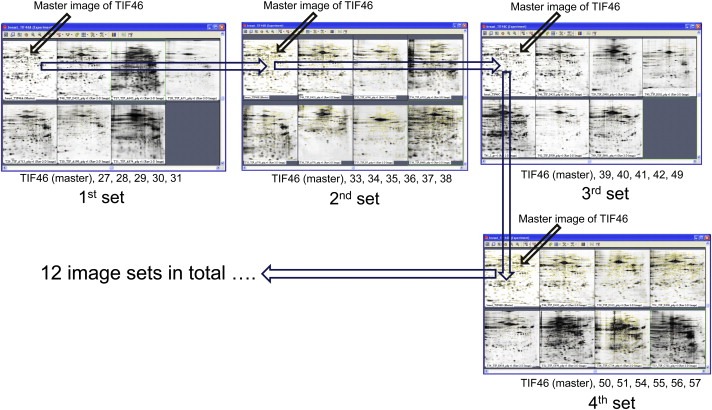
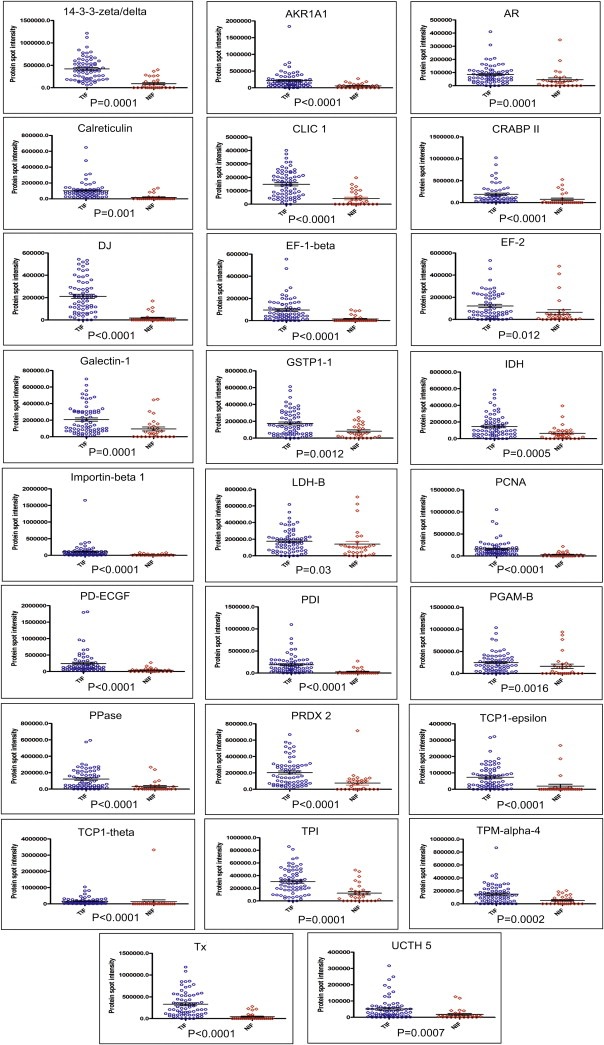
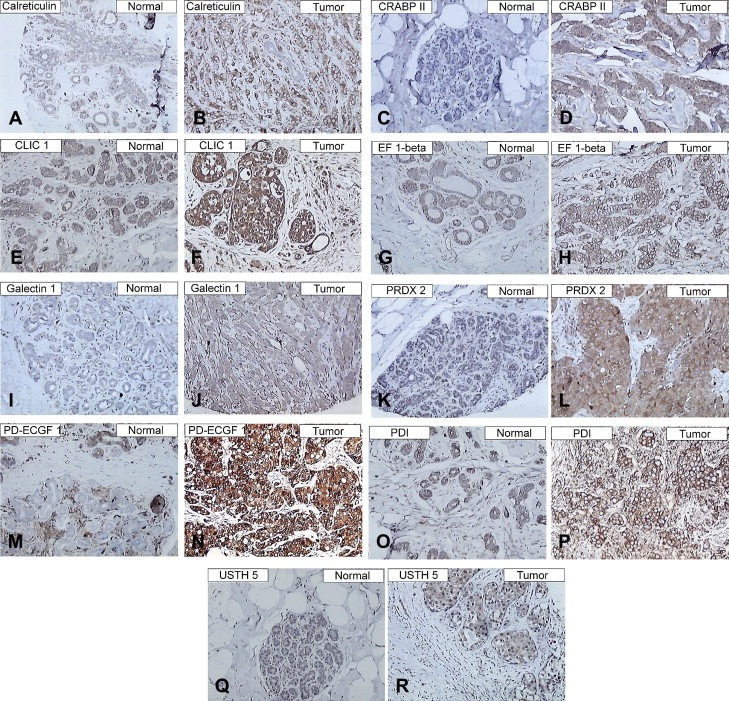
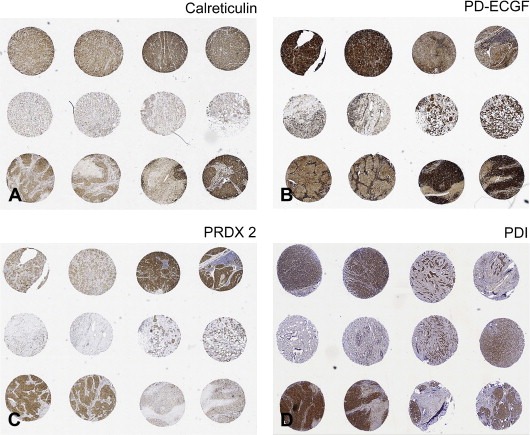
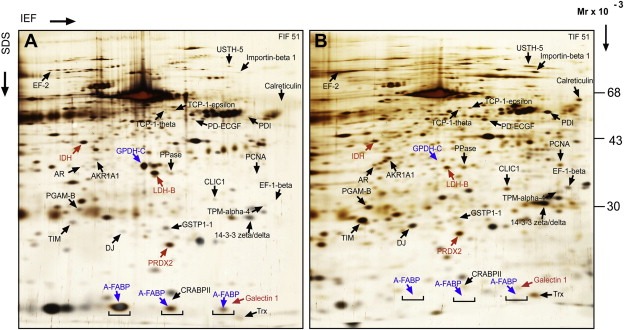
Breast cancer is by far the most common diagnosed form of cancer and the leading cause of cancer death in women today. Clinically useful biomarkers for early detection of breast cancer could lead to a significant reduction in mortality. Here we describe a detailed analysis using gel-based proteomics in combination with mass spectrometry and immunohistochemistry (IHC) of the tumour interstitial fluids (TIF) and normal interstitial fluids (NIF) collected from 69 prospective breast cancer patients. The goal of this study was to identify abundant cancer up-regulated proteins that are externalised by cells in the tumour microenvironment of most if not all these lesions. To this end, we applied a phased biomarker discovery research strategy to the analysis of these samples rather than comparing all samples among each other, with inherent inter and intra-sample variability problems. To this end, we chose to use samples derived from a single tumour/benign tissue pair (patient 46, triple negative tumour), for which we had well-matched samples in terms of epithelial cell numbers, to generate the initial dataset. In this first phase we found 110 proteins that were up-regulated by a factor of 2 or more in the TIF, some of which were confirmed by IHC. In the second phase, we carried out a systematic computer assisted analysis of the 2D gels of the remaining 68 TIF samples in order to identify TIF 46 up-regulated proteins that were deregulated in 90% or more of all the available TIFs, thus representing common breast cancer markers. This second phase singled out a set of 26 breast cancer markers, most of which were also identified by a complementary analysis using LC-MS/MS. The expression of calreticulin, cellular retinoic acid-binding protein II, chloride intracellular channel protein 1, EF-1-beta, galectin 1, peroxiredoxin-2, platelet-derived endothelial cell growth factor, protein disulfide isomerase and ubiquitin carboxyl-terminal hydrolase 5 were further validated using a tissue microarray containing 70 malignant breast carcinomas of various grades of atypia. A significant number of these proteins have already been detected in the blood/plasma/secretome by others. The next steps, which include biomarker prioritization based on the hierarchal evaluation of these markers, antibody and antigen development, assay development, analytical validation, and preliminary testing in the blood of healthy and breast cancer patients, are discussed.
Figures
References
-
- Aebersold, R. , Mann, M. , 2003. Mass spectrometry-based proteomics. Nature. 422, 198–207. - PubMed
-
- Agha-Hosseini, F. , Mirzaii-Dizgah, I. , Rahimi, A. , 2009. Correlation of serum and salivary CA15-3 levels in patients with breast cancer. Med. Oral. Patol. Oral. Cir. Bucal. 14, e521–e524. - PubMed
-
- Anderson, N.L. , Polanski, M. , Pieper, R. , Gatlin, T. , Tirumalai, R.S. , Conrads, T.P. , Veenstra, T.D. , Adkins, J.N. , Pounds, J.G. , Fagan, R. , Lobley, A. , 2004. The human plasma proteome: a nonredundant list developed by combination of four separate sources. Mol. Cell. Proteomics. 3, 311–326. - PubMed
-
- Apweiler, R. , Aslanidis, C. , Deufel, T. , Gerstner, A. , Hansen, J. , Hochstrasser, D. , Kellner, R. , Kubicek, M. , Lottspeich, F. , Maser, E. , Mewes, H.W. , Meyer, H.E. , Müllner, S. , Mutter, W. , Neumaier, M. , Nollau, P. , Nothwang, H.G. , Ponten, F. , Radbruch, A. , Reinert, K. , Rothe, G. , Stockinger, H. , Tarnok, A. , Taussig, M.J. , Thiel, A. , Thiery, J. , Ueffing, M. , Valet, G. , Vandekerckhove, J. , Verhuven, W. , Wagener, C. , Wagner, O. , Schmitz, G. , 2009. Approaching clinical proteomics: current state and future fields of application in fluid proteomics. Clin. Chem. Lab. Med. 47, 724–744. - PubMed
Publication types
MeSH terms
Substances
LinkOut - more resources
Full Text Sources
Other Literature Sources
Medical
Research Materials
