. 2010 Feb 26;396(3):580-92.
doi: 10.1016/j.jmb.2009.12.006. Epub 2009 Dec 11.

The electrostatics of VDAC: implications for selectivity and gating

Affiliations

The electrostatics of VDAC: implications for selectivity and gating

Om P Choudhary et al. J Mol Biol. .

Abstract

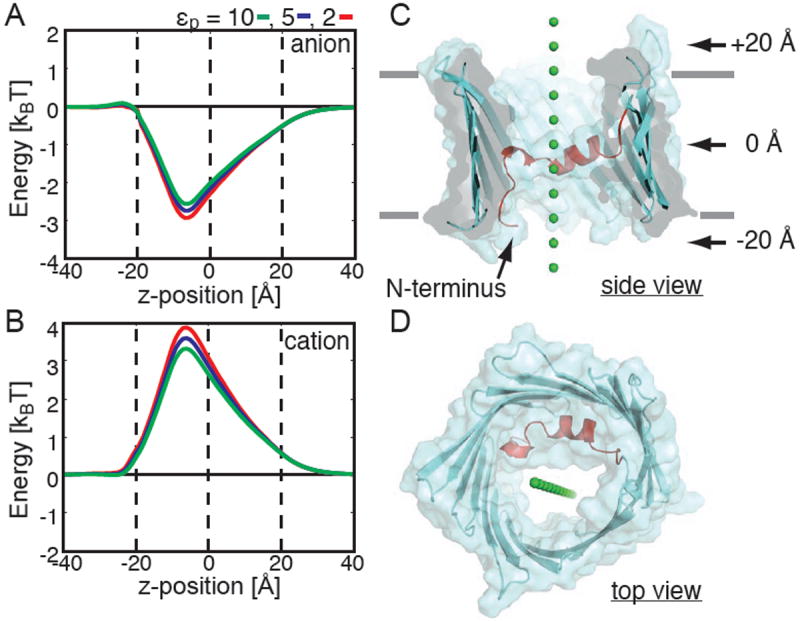
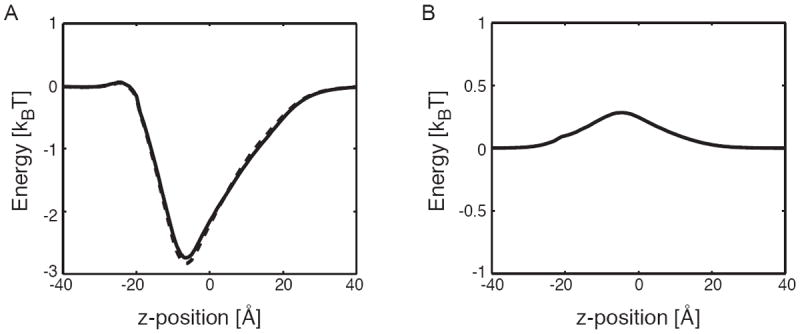
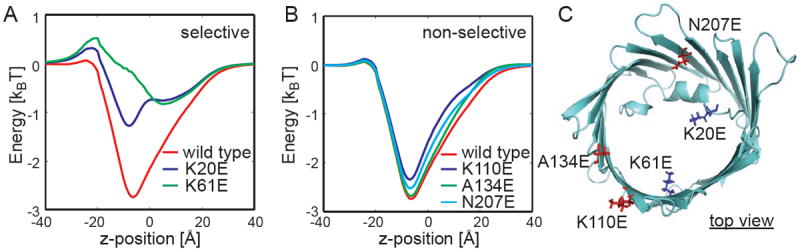
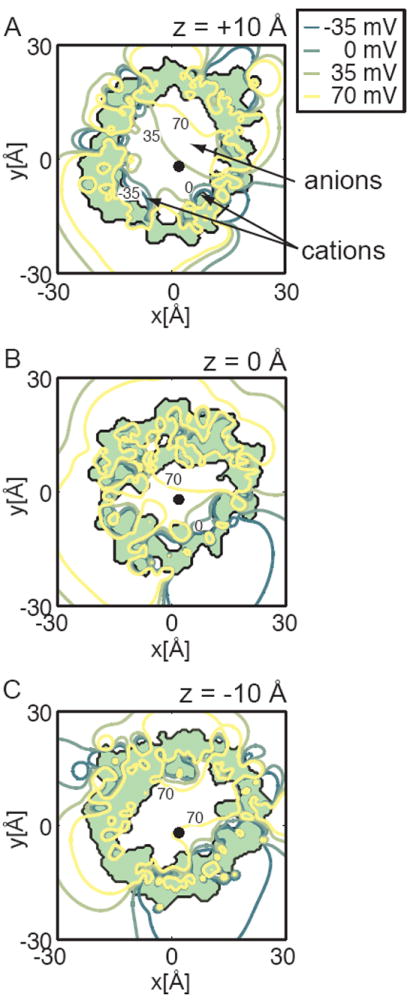
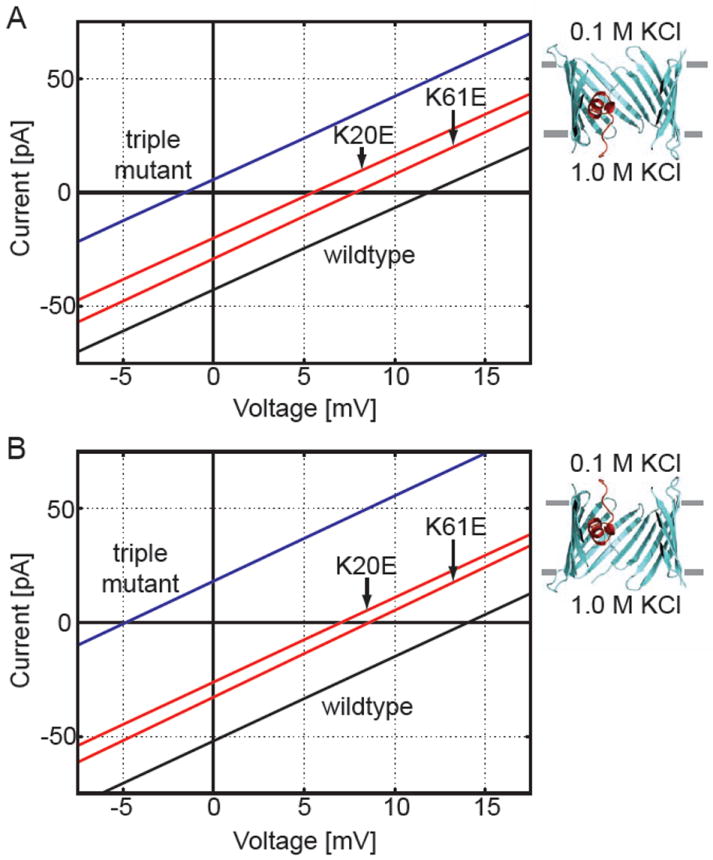
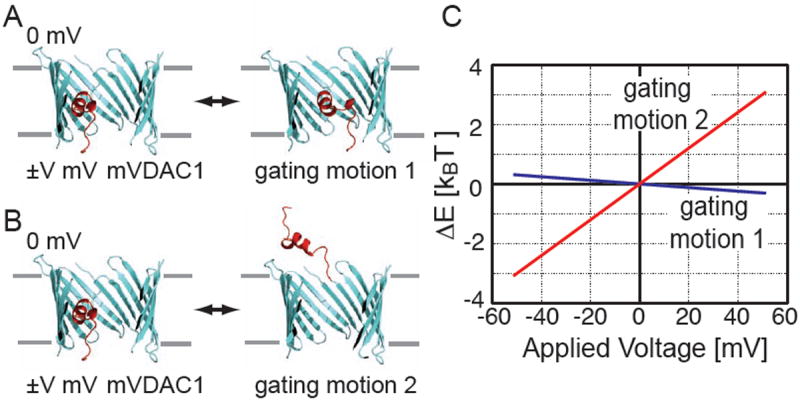
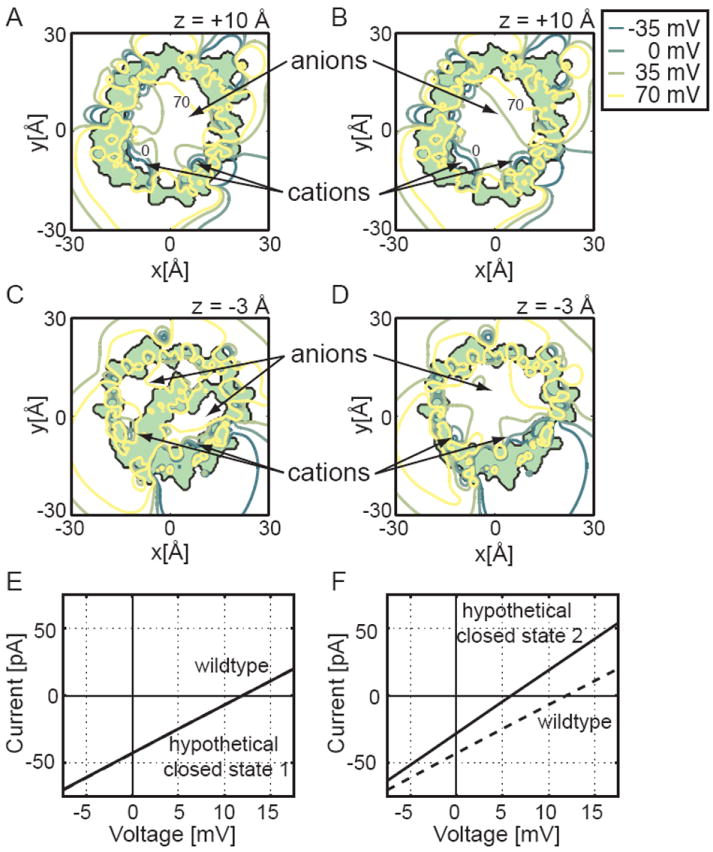
The voltage-dependent anion channel (VDAC) is the major pathway mediating the transfer of metabolites and ions across the mitochondrial outer membrane. Two hallmarks of the channel in the open state are high metabolite flux and anion selectivity, while the partially closed state blocks metabolites and is cation selective. Here we report the results from electrostatics calculations carried out on the recently determined high-resolution structure of murine VDAC1 (mVDAC1). Poisson-Boltzmann calculations show that the ion transfer free energy through the channel is favorable for anions, suggesting that mVDAC1 represents the open state. This claim is buttressed by Poisson-Nernst-Planck calculations that predict a high single-channel conductance indicative of the open state and an anion selectivity of 1.75--nearly a twofold selectivity for anions over cations. These calculations were repeated on mutant channels and gave selectivity changes in accord with experimental observations. We were then able to engineer an in silico mutant channel with three point mutations that converted mVDAC1 into a channel with a preference for cations. Finally, we investigated two proposals for how the channel gates between the open and the closed state. Both models involve the movement of the N-terminal helix, but neither motion produced the observed voltage sensitivity, nor did either model result in a cation-selective channel, which is observed experimentally. Thus, we were able to rule out certain models for channel gating, but the true motion has yet to be determined.


Figures

Fig. 1
Fig. 1
mVDAC1 is selective for anions. Ion transfer free energies calculated through mVDAC1 for a chloride-sized anion (A) and a potassium-sized cation (B). Energies were calculated using the Poisson-Boltzmann equation after embedding mVDAC1 in a low dielectric, εm= 2, slab corresponding to the membrane. The path for both ions through the channel is pictured in panels C (side view) and D (top view). Varying the protein dielectric constant, εp, had little effect on the free energy profiles. For all calculations, z = 0 corresponds to the center of the channel, and the channel extends from -20 to +20 Å. These positions are indicated by dashed lines in panels A and B.
Fig. 2
Fig. 2
Protein charges dominate the ion transfer free energy. (A) Ion transfer free energy profiles through mVDAC1 for a chloride-sized anion in the absence (dashed curve) and presence (solid curve) of the membrane. The membrane has very little effect on the permeation energetics. (B) Born solvation energy for anion permeation. The energy peaks near the N-terminal helix (-7.5 Å) at 0.25 kBT. Such a small value indicates that ions remain largely solvated during the transfer from one side of the pore to the other. Panels A and B indicate that the electrostatic interactions of the permeant ions with the permanent charges on mVDAC1 dominate the ion transfer free energy. In both panels that protein dielectric, εp, was set to 5.
Fig. 3
Fig. 3
Altered ion transfer free energies through mVDAC1 match measured changes to selectivity. (A) Free energy profile for a chloride anion moving through the wild-type (red) and two mutant channels: K20E (blue) and K61E (green). K20E and K61E significantly destabilize the anion in the channel, and this is consistent with experimental measurements. (B) Mutations K110E, A134E, and N207E have little effect on the free energy profile, which is in excellent agreement with experiment. (C) All residues are pictured. The selective positions (blue) are much closer to the permeation pathway, while the nonselective positions (red) are farther away.
Fig. 4
Fig. 4
The electrostatic potential at three different heights in the pore. The potential contours due to the protein charges were calculated as in Fig. 1 and then plotted at z = +10 Å (A), z = 0 Å (B) and z = -10 Å (C). Each view is along the pore’s long axis, and the protein interior is shaded light green. The ion path used for all calculations in Figs. 1-3 is indicated by a black dot in each panel. Five equally spaced isocontours were chosen with the blue representing negative potential values and the red values representing more positive values. The contour at 0 mV is indicated in panels A and B, while the +70 mV contour is shown in each. The 0 mV contour divides the region favorable to anions (positive values at positive y values) and cations (negative values at negative y values). The pore is dominated by positive potential values at all heights, especially at z = -10 Å. The ion path falls along contour values that are representative of the average value at each height. At z = +10 Å the value is ~ +30 mV, near the middle of the full range of values. In panel B, the positive potentials occupy more of the cross-sectional area, and the electrostatic potential at the ion pathway increases to +50 mV. In panel C, close to the N-terminal helix, the potential is entirely positive. This is in accord with the anion free energy minimum and cation barrier observed in Fig. 1A,B.
Fig. 5
Fig. 5
Wild-type and mutant current-voltage curves calculated using PNP theory. The upper bath was held at 0.1 M KCl and the lower bath at 1.0 KCl. The applied voltage is the value in the lower bath relative to the upper bath. Under these conditions, positive reversal potentials indicate that the channel is anion selective. (A) The channel was embedded in a dielectric slab with the N and C-termini facing the lower solution. The black line is the wild-type curve, and the red curves correspond to K20E and K61E. The leftward shift of both red curves indicates that both mutants reduce the anion selectivity of mVDAC1. The blue curve corresponds to the K20E/K61E/K96E triple mutant. This curve has a negative reversal potential indicating that the channel has been engineered to be cation selective. (B) The orientation of the channels in the membrane were reversed compared to panel A. In this case, the N and C-termini face the upper bath. Interestingly, the reversal potentials are all shifted compared to those in panel A demonstrating that the channel’s selectivity depends on its orientation in the membrane.
Fig. 6
Fig. 6
Voltage dependence of the mVDAC1 x-ray structure compared to two hypothetical gating motions. (A) mVDAC1 is pictured on the left and a hypothetical partially closed state suggested by Ujwal et al. (ref. ) is on the right (gating motion 1). (B) mVDAC1 is pictured on the left and the N-terminal helix (red) has been removed from the pore on the right (gating motion 2). (C) Poisson-Boltzmann calculations were carried out to determine the membrane potential’s contribution to the energy difference between these sets of structures (ΔE = Ehypo. state − EmVDAC1). The outer bath was held at 0 mV and the inner bath was varied from -50 to +50 mV. To represent the hypothetical state in panel B, the helix was deleted from mVDAC1 as discussed in the text. The energy difference between the states in A is represented by the blue curve, and the difference between the states in B is represented by the red curve. Gating motion 1 shows no voltage dependence, while gating motion 2 has a voltage-sensor valence of 1.5.
Fig. 7
Fig. 7
Biophysical properties of the two hypothetical closed states. The electrostatic potential of hypothetical closed state 1 was calculated and plotted at z = +10 Å (A) and z = -3 Å (C), and the isocontours for hypothetical closed state 2 were plotted at z = +10 Å (B) and z = -3 Å (D). Each channel is viewed along the pore’s long axis, and the protein interior is shaded light green. We see in panel C that the N-terminal helix occludes the middle of the pore of hypothetical closed state 1, but panels B and D show that hypothetical closed state 2 has an unobstructed pore at all levels. As in Fig. 4, four equally spaced isocontours are depicted with dark green curves representing negative potentials and yellow curves representing more positive potentials. From panel C we see that closed model 1 has only a very small portion of the pore favorable to cation passage. Current-voltage curves for closed state 1 (E) and closed state 2 (F) were also carried out using PNP calculations. The conductance of hypothetical closed state 1 (solid) is so similar to wild type (dashed) that it is hard to distinguish both curves. Due to the larger pore diameter, hypothetical closed state 2 has an increased conductance, indicated by a steeper slope (solid curve) compared to the wild type (dashed). Since the current-voltage curve in panel F crosses the x-axis at a positive potential, the channel is anion selective as is the wild-type channel.

Similar articles

Cited by

References

    1. Schein SJ, Colombini M, Finkelstein A. Reconstitution in planar lipid bilayers of a voltage-dependent anion-selective channel obtained from paramecium mitochondria. J Membr Biol. 1976;30:99–120. - PubMed
    1. Rostovtseva T, Colombini M. VDAC channels mediate and gate the flow of ATP: implications for the regulation of mitochondrial function. Biophys J. 1997;72:1954–62. - PMC - PubMed
    1. Colombini M. Voltage gating in the mitochondrial channel, VDAC. J Membr Biol. 1989;111:103–11. - PubMed
    1. Adams JM, Cory S. The Bcl-2 protein family: arbiters of cell survival. Science. 1998;281:1322–6. - PubMed
    1. Shimizu S, Narita M, Tsujimoto Y. Bcl-2 family proteins regulate the release of apoptogenic cytochrome c by the mitochondrial channel VDAC. Nature. 1999;399:483–7. - PubMed

Publication types

LinkOut - more resources