

Brain ERP components predict which individuals progress to Alzheimer's disease and which do not
- PMID: 20005599
- PMCID: PMC2902777
- DOI: 10.1016/j.neurobiolaging.2009.11.010
Brain ERP components predict which individuals progress to Alzheimer's disease and which do not
Abstract
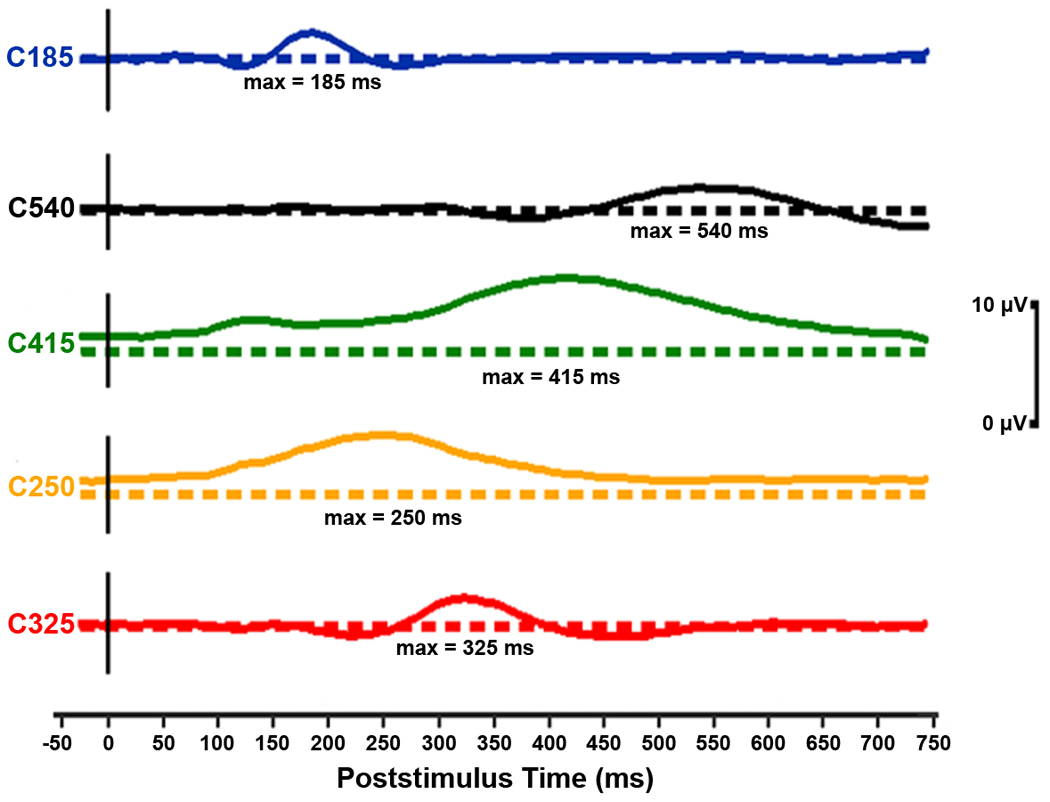
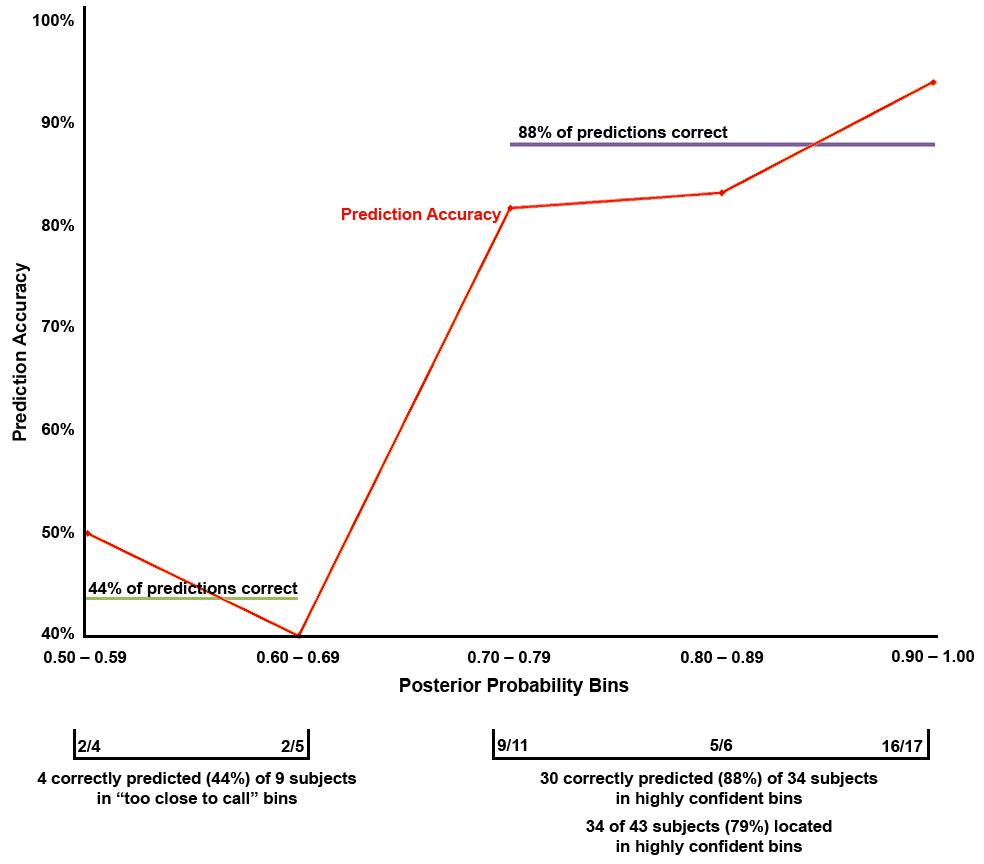
Predicting which individuals will progress to Alzheimer's disease (AD) is important in both clinical and research settings. We used brain Event-Related Potentials (ERPs) obtained in a perceptual/cognitive paradigm with various processing demands to predict which individual Mild Cognitive Impairment (MCI) subjects will develop AD versus which will not. ERP components, including P3, memory "storage" component, and other earlier and later components, were identified and measured by Principal Components Analysis. When measured for particular task conditions, a weighted set of eight ERP component_conditions performed well in discriminant analysis at predicting later AD progression with good accuracy, sensitivity, and specificity. The predictions for most individuals (79%) had high posterior probabilities and were accurate (88%). This method, supported by a cross-validation where the prediction accuracy was 70-78%, features the posterior probability for each individual as a method of determining the likelihood of progression to AD. Empirically obtained prediction accuracies rose to 94% when the computed posterior probabilities for individuals were 0.90 or higher (which was found for 40% of our MCI sample).
Copyright © 2009 Elsevier Inc. All rights reserved.
Conflict of interest statement
Disclosure Statement
No author involved with this article had any conflicts of interest regarding this research. Our study received IRB approval from the University of Rochester Research Subjects Review Board, and informed consent was obtained for each subject.
Figures

References
-
- Achim A, Marcantoni W. Principal component analysis of event-related potentials: misallocation of variance revisited. Psychophysiol. 1997;34:597–606. - PubMed
-
- Ahlgren A. Multivariate Analysis. Science. 1986;234:530–531. - PubMed
-
- American Psychiatric Association. Diagnostic and statistical manual of mental disorders. Fourth ed., text rev. Washington, DC: Author; 2000.
-
- Beauducel A, Debener S. Misallocation of variance in event-related potentials: simulation studies on the effects of test power, topography, and baseline-to-peak versus principal component quantifications. J. Neurosci. Methods. 2003;124:103–112. - PubMed
-
- Begleiter H, Porjesz B, Wang W. A neurophysiologic correlate of visual short-term memory in humans. Electroencephal. Clin. Neurophysiol. 1993;87:46–53. - PubMed
Publication types
MeSH terms
Grants and funding
LinkOut - more resources
Full Text Sources
Medical
