. 2009 Dec 10;64(5):730-43.
doi: 10.1016/j.neuron.2009.11.018.

Flexibility of sensory representations in prefrontal cortex depends on cell type

Affiliations

Flexibility of sensory representations in prefrontal cortex depends on cell type

Cory R Hussar et al. Neuron. .

Abstract

Discrimination tasks require processing, interpreting, and linking sensory information to the appropriate motor response. We report that neurons in prefrontal cortex (PFC) represent visual motion with precision comparable to cortical neurons at early stages of motion processing, and readily adapt this representation to behavioral context. We found that direction selectivity, recorded while the monkeys discriminated directions, decreased when they judged motion speed and ignored its direction. This decrease was more pronounced in neurons classified as narrow-spiking (NS) putative interneurons than in broad-spiking (BS) putative pyramidal neurons. However, during passive fixation, when the link between motion and its behavioral relevance was removed, both cell types showed a severe selectivity loss. Our results show that flexible sensory representation during active discrimination tasks is achieved in the PFC by a specialized neuronal network of both NS neurons readily adjusting their selectivity to behavioral context, and BS neurons capable of maintaining relatively stable sensory representation.


Figures

Figure 1
Figure 1. Behavioral tasks, behavioral performance, cell classification and recording sites
a. Direction discrimination task. The animals reported whether the directions of motion of two random-dot stimuli separated in time, sample and test, were the same or different by pressing one of two response buttons. The top diagram shows a trial with the same directions (indicated by arrows) presented during the sample and the test. The bottom diagram shows a trial in which the two directions were different. During the task, the two types of trials were randomly interleaved and the differences in directions between the sample and the test were selected to bracket the threshold defined as stimulus value taken at 75% correct (see d). The stimuli were centered on the fixation target (small circle) and the animals were required to maintain fixation within a 2° window throughout the trial. b. Speed discrimination task. The animals fixated a small triangle and reported whether the speeds of the sample and the test were the same or different by pressing one of the two response buttons. The top and the bottom diagrams show the “same” and “different” speed trials, respectively. The shorter arrow in the bottom diagram indicates slower speed in the test. Like during the direction task, the two types of trials were randomly interleaved and speed differences between sample and test were chosen to bracket the animal's threshold (see e). Sample and test always moved in the same, either preferred or anti-preferred, direction. c. Passive fixation task. Stimulus conditions were identical to those in the direction discrimination task. The monkeys were required to maintain fixation throughout the trial on a small cross and were rewarded after the offset of the second stimulus. d-e. Representative psychometric functions for the two monkeys measured during the direction and the speed discrimination tasks. f. Classification of neurons into narrow-spiking (NS) and broad-spiking (BS) cells. The duration of action potentials was estimated by measuring the time between the trough and the peak of each average action potential, as shown for the two example NS (red) and BS (blue) neurons. The value of 200μs was used as the longest duration for the NS neurons. g. Average action potentials of all recorded task-related neurons (n=132) classified into NS (n=29) and BS (n=103) cells. h. The distribution of action potential durations for these neurons was significantly bimodal (Hartigan's dip test, p = .02). i. Locations of all DS neurons recorded during the direction discrimination task. Lighter and darker circles indicate positions of neurons recorded from each monkey.
Figure 2
Figure 2. Example responses to motion during the three tasks
The plots show responses of each example neuron to identical moving sample stimuli presented during the direction (left plots), the speed (middle plots) and the passive fixation (right plots) tasks. a. Response of a BS neuron (spike duration, 323μs) to the preferred and the anti-preferred directions. This neuron's direction selective (DS) response recorded during the direction task did not change substantially during the speed task (middle plot). During passive fixation, the responses to both directions decreased and were no longer DS. b. Response of this NS neuron (spike duration: 133μs) to the direction identified as anti-preferred during the direction task increased while its response to the preferred direction decreased. During passive fixation, the anti-preferred response increased to the level of the preferred response showing a complete loss of DS. c. Response of this BS neuron (spike duration: 360μs) was suppressive and during the direction task this suppression was less pronounced for the anti-preferred direction. During the speed and the passive fixation tasks, the anti-preferred response became more suppressed, approaching the response to the preferred direction with the result of the greatly weakened DS.
Figure 3
Figure 3. Average responses to motion during the three tasks
Average excitatory responses recorded during the direction discrimination task (a, b), the speed discrimination task (c, d), and the passive fixation task (e, f). Sample and test responses are shown separately for NS (red plots) and BS (blue plots) neurons. For each neuron, the mean baseline activity during the 200ms prior to the onset of the sample was subtracted from the response. During the direction discrimination task, all NS neurons (sample, n=17; test, n=15) and BS neurons (sample, n=44; test, n=44) contributing to the data were direction selective (a, b). A subset of NS neurons (sample, n=13; test, n=14) and BS neurons (sample, n=32; test, n=36) tested in the direction task, were also tested during the speed task (c, d). The data collected during passive fixation are based on responses of 10 NS and 23 and 20 BS neurons during the sample and the test, respectively. (e, f). Note, that for NS neurons, the difference between responses to the preferred and the anti-preferred direction, maximal during the direction task (a), decreased during the speed task (c), becoming minimal during passive fixation (e). For BS neurons, the difference between preferred and anti-preferred activity changed little during the speed task (d), but decreased during the passive fixation (f). The thin lines on each plot show +−SEM.
Figure 4
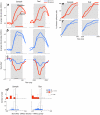
Figure 4. Reduction of direction selectivity during the speed task
a. Average DS for NS neurons in response to the sample (n=14) and the test (n=15) during the direction task (solid red lines) and the speed task (broken red lines). DS, expressed as the area under the ROC curve (AROC), was computed by comparing firing rates to the two directions (see text). The data, representing responses of the same group of neurons tested during the two tasks, show a decrease in DS during the speed task. The period of significant differences in DS between the two tasks is indicated at the bottom of the graph by thick red lines. The differences were evaluated by sliding a 100ms window every 50ms during the course of both responses (Wilcoxon signed-rank test; p<0.05). b. Average DS for BS neurons in response to the sample (n=37) and the test (n=41) recorded during the direction task (solid blue lines) and the speed task (broken blue lines). c. The task effect was computed for each neuron as the difference between DS curves computed during the two tasks and averaged. The task-induced change in DS was evaluated by sliding a 100ms window stepped at 50ms across the response and determining periods during which the DS was significantly different during the two tasks (WIlcoxon signed-rank test; p<0.05). Thick black lines below each plot indicate times at which the size of the task effect is significantly different between the two classes of neurons (Mann-Whitney U; p<0.05). d. Distribution of task effects shown in c, measured during the period of 200-400ms from stimulus onset. Neurons with significant task effects (ANOVA; p<0.05) are indicated by red (NS neurons) and blue (BS neurons) columns, while the white columns show neurons with non-significant task effects. The area to the left of 0 (indicated by a dotted line) indicates a decrease in DS. e,f. Cumulative increase in the proportion of DS NS (e) and BS (f) neurons after stimulus onset of the sample and the test during the direction (solid line) and the speed (dotted line) tasks. Note, that between 15-20% of NS (red) and BS (blue) neurons, classified as DS during the direction task, no longer showed any significant DS during speed discrimination.
Figure 5
Figure 5. Reduction of direction selectivity during the passive fixation task
a. Average DS for the NS neurons in response to the sample (n=12) and the test (n=10) during the direction task (solid red lines) and the passive fixation task (broken red lines). b. Average DS for BS neurons in response to the sample (n=32) and the test (n=29) recorded during the direction task (solid blue lines) and the passive fixation task (broken blue lines). c. Average task effect for NS (red curve) and BS neurons (blue curve) showing a decrease in DS during the passive fixation in both cell types. d. Distribution of task effects shown in c, measured during the period of 200-400ms from stimulus onset. Neurons with significant task effects (ANOVA; p<0.05) are indicated by red (NS neurons) and blue (BS neurons) columns, while the white columns show neurons with non-significant task effects. e, f. Cumulative increase in the proportion of NS (e) and BS (f) DS neurons after the onset of the sample and test during the direction (solid line) and the passive fixation (dotted line) tasks. For other details see the legends for Fig 4.
Figure 6
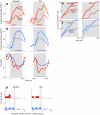
Figure 6. Changes in preferred and anti-preferred responses during the speed task
a&c. Average task effects for NS (left plots) and BS (right plots) neurons computed separately for preferred (solid red or blue lines) and anti-preferred (broken red or blue lines) directions. The task effect was computed as (response speed−response dir)/(response speed + response dir). The task effect curve for each direction was generated by sliding a 200 ms window in 25ms increments across responses generated during each task. Thick colored lines below each graph represent periods in which the task effect for the preferred or antipreferred direction was significantly different from zero (WIlcoxon signed-rank test; p<0.05). b & d. Distribution of task effects for the preferred direction (top row) and anti-preferred direction (bottom row) for individual neurons contributing to the data shown in a & c. The data represent activity recorded during the period of 200-400ms after stimulus onset. NS neurons with significant changes in activity are shown as red (Mann-Whitney U; p<0.05). The red columns correspond to the red lines and the pink columns to the pink lines in the plots shown in a & c. Similarly, the blue columns correspond to the blue lines and the pale blue columns to the pale blue lines BS neurons with significant changes in activity are shown as blue (preferred) and pale blue (anti-preferred) columns (Mann-Whitney U; p<0.05).
Figure 7
Figure 7. Changes in preferred and anti-preferred responses during the passive fixation task
a & c. Average task effects for NS and BS neurons computed separately for preferred (solid red and blue lines) and anti-preferred (broken red and blue lines) directions. b & d. Distribution of task effects for individual neurons contributing to the data shown in a & c. For other details see the legend in Fig 6.

Similar articles

Cited by

References

    1. Asaad WF, Rainer G, Miller EK. Task-specific neural activity in the primate prefrontal cortex. Journal of Neurophysiology. 2000;84:451–459. - PubMed
    1. Barbas H. Anatomic organization of basoventral and mediodorsal visual recipient prefrontal regions in the rhesus monkey. Journal of Comparative Neurology. 1988;276:313–342. - PubMed
    1. Bartho P, Hirase H, Monconduit L, Zugaro M, Harris KD, Buzsaki G. Characterization of Neocortical Principal Cells and Interneurons by Network Interactions and Extracellular Features. J Neurophysiol. 2004;92:600–608. %R 10.1152/jn.01170.2003. - PubMed
    1. Britten KH, Shadlen MN, Newsome WT, Movshon JA. The analysis of visual motion: a comparison of neuronal and psychophysical performance. Journal of Neuroscience. 1992;12:4745–4765. - PMC - PubMed
    1. Cardin JA, Palmer LA, Contreras D. Stimulus Feature Selectivity in Excitatory and Inhibitory Neurons in Primary Visual Cortex. J. Neurosci. 2007;27:10333–10344. - PMC - PubMed

Publication types