. 2009 Dec 11;36(5):900-11.
doi: 10.1016/j.molcel.2009.11.016.

Revealing global regulatory perturbations across human cancers

Affiliations

Revealing global regulatory perturbations across human cancers

Hani Goodarzi et al. Mol Cell. .

Abstract

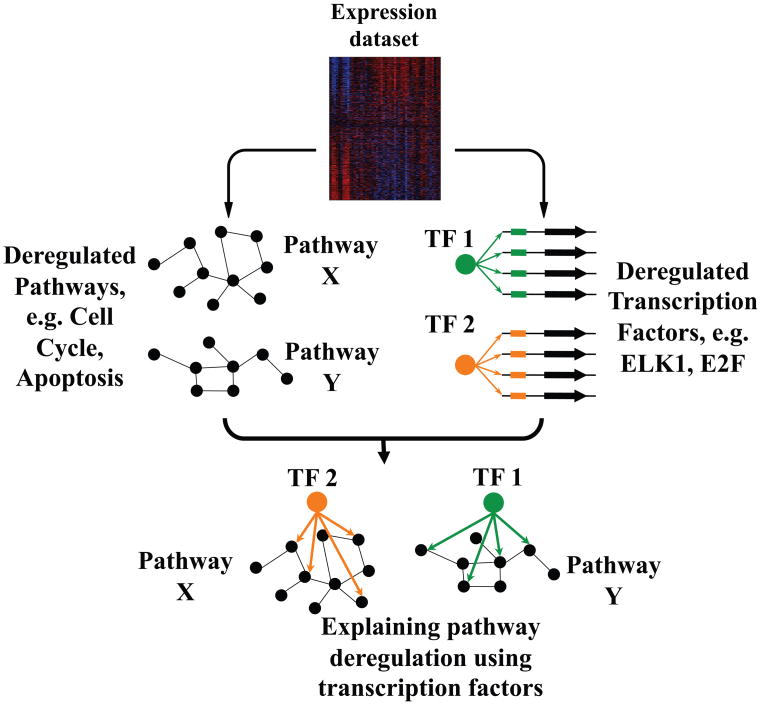
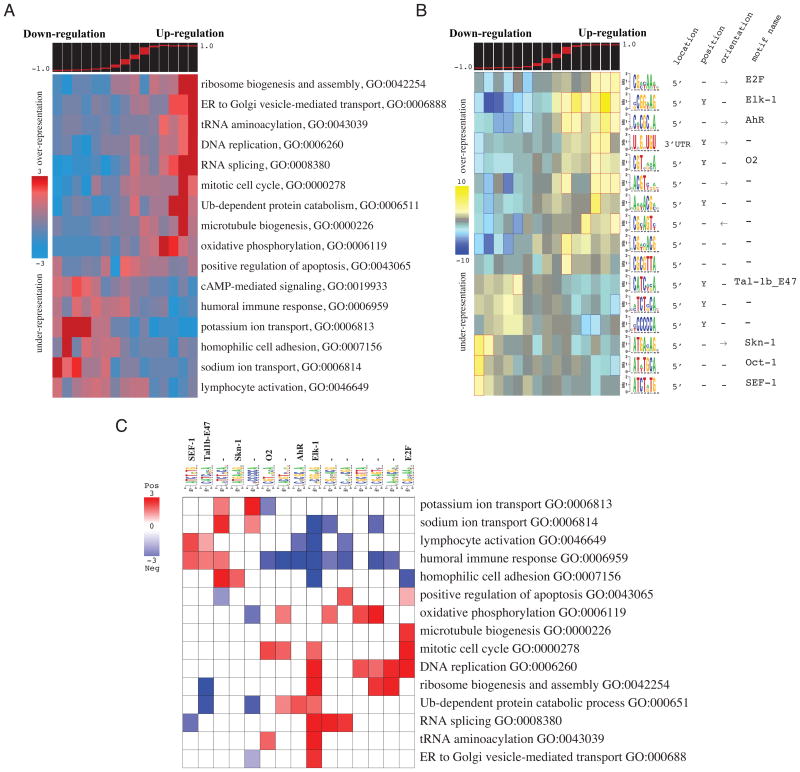
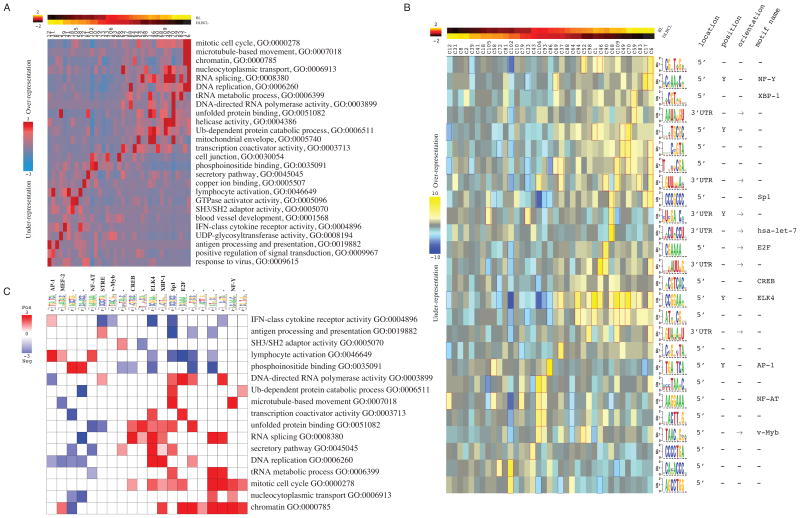
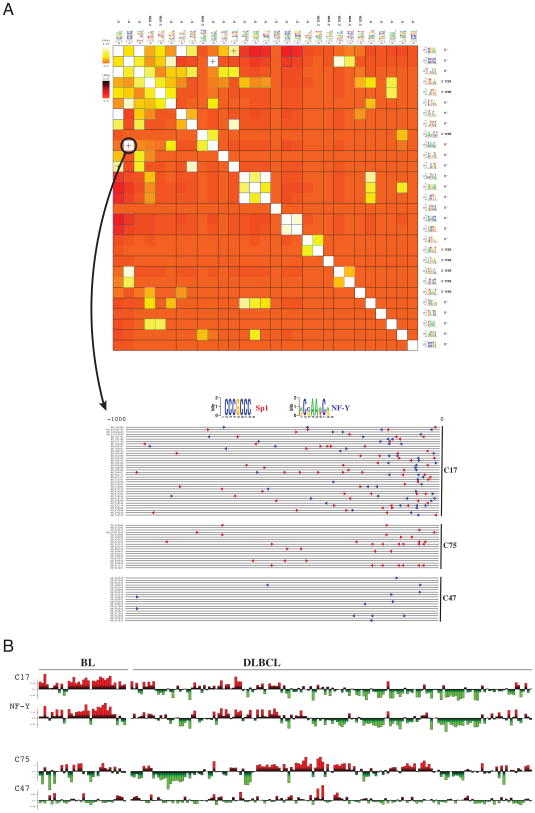
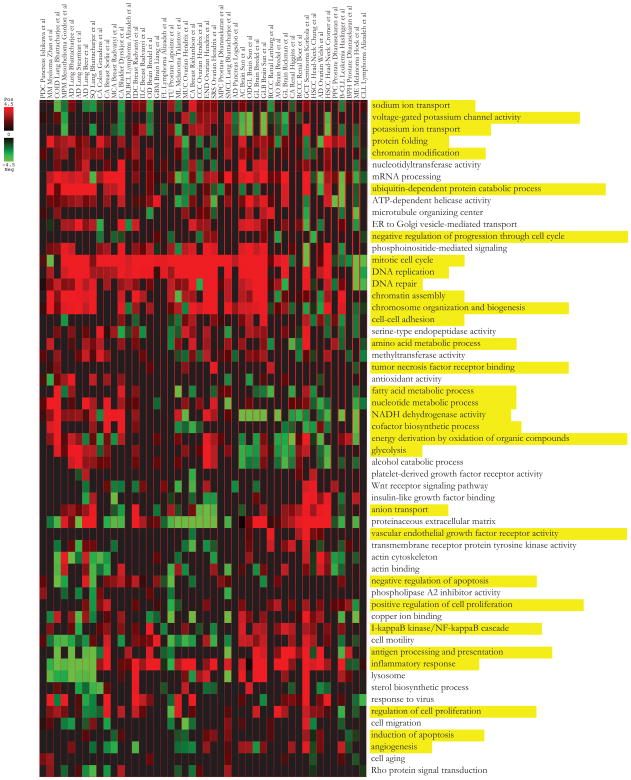
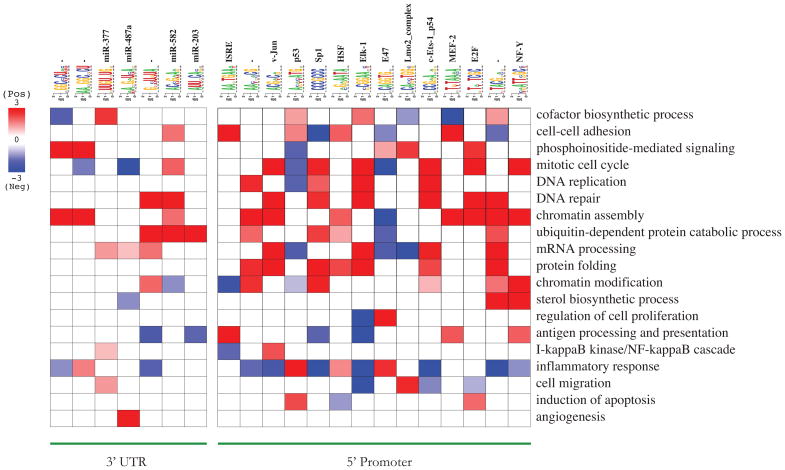
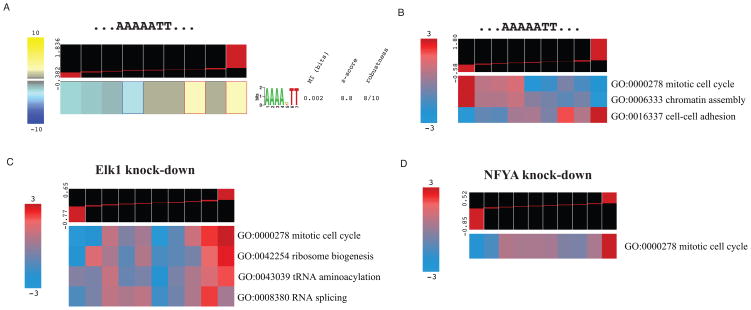
The discovery of pathways and regulatory networks whose perturbation contributes to neoplastic transformation remains a fundamental challenge for cancer biology. We show that such pathway perturbations, and the cis-regulatory elements through which they operate, can be efficiently extracted from global gene expression profiles. Our approach utilizes information-theoretic analysis of expression levels, pathways, and genomic sequences. Analysis across a diverse set of human cancers reveals the majority of previously known cancer pathways. Through de novo motif discovery we associate these pathways with transcription-factor binding sites and miRNA targets, including those of E2F, NF-Y, p53, and let-7. Follow-up experiments confirmed that these predictions correspond to functional in vivo regulatory interactions. Strikingly, the majority of the perturbations, associated with putative cis-regulatory elements, fall outside of known cancer pathways. Our study provides a systems-level dissection of regulatory perturbations in cancer-an essential component of a rational strategy for therapeutic intervention and drug-target discovery.


Figures

Figure 1
Figure 1. Revealing local regulatory networks from gene expression data
Perturbed pathways and informative cis-regulatory elements are inferred from cancer-related global gene expression profiles. The discovered pathways are then associated with local DNA and RNA elements in order to reconstruct the underlying regulatory networks (see also Figure S1).
Figure 2
Figure 2. Pathway and regulatory perturbations in bladder cancer
(A) Shown are the informative pathways discovered by iPAGE and their patterns of over-representation across the cancer vs. normal expression differences. These differences are partitioned into discrete “expression bins”. Each expression bin includes genes within a specific range of expression values (shown in the top panel). Bins to the left contain genes with lower expression in cancer samples whereas the ones to the right contain genes with higher expression. In the heatmap representation, rows correspond to pathways, and columns to consecutive expression bins. Red entries indicate enrichment of pathway genes in a given expression bin. Enrichment and depletion are measured using hypergeometric p-values (log-transformed) as described in Suppl. Procedures. (B) Shown are the over-representation patterns of the putative cis-regulatory elements discovered by FIRE across the spectrum of cancer vs. normal expression differences. In this heatmap, rows correspond to the discovered motifs and columns to expression bins (see Also Figure S2A and B). Yellow entries in the heatmap indicate motif over-representation (measured by negative log-transformed hypergeometric p-values), while blue entries indicate under-representation (log-transformed p-values). (C) The resulting pathway-regulatory interaction map showing the putative associations between regulatory elements and pathways. Rows correspond to informative iPAGE pathways and columns to informative FIRE motifs. Red entries in this heatmap correspond to a positive association where the genes belonging to a pathway are also enriched in a given motif (measured using log-transformed hypergeometric p-values). Blue entries correspond to significant motif depletions in the upstream sequences (or 3′ UTRs) of genes in a given pathway (see Also Figure S2C).
Figure 3
Figure 3. Differential pathway perturbations between Burkitt’s lymphoma (BL) and diffuse large B-cell lymphoma (DLBCL)
(A) Differentially expressed pathways uncovered by iPAGE and their pattern of over-representation across BL/DLBCL co-expression clusters. In this representation, columns represent co-expression clusters while rows correspond to informative pathways. The top panel shows the normalized average expression of each gene cluster in BL and DLBCL samples. (B) A subset of putative cis-regulatory elements discovered by FIRE in BL vs. DLBCL co-expression clusters. (C) The pathway-regulatory interaction map reveals the association between the identified regulatory elements (and their cognate binding factors, when known) and the pathways that are differentially expressed in BL vs DLBCL (see also Figure S3).
Figure 4
Figure 4. Cis-regulatory element interactions and combinatorial regulation
(A) The FIRE regulatory interaction matrix for the cis-regulatory elements discovered in the BL vs. DLBCL dataset (Figure 3B), and an accompanying motif map showing co-localization of Sp1 and NF-Y sites. In the FIRE interaction matrix, lighter colors (white and yellow) correspond to significant motif co-occurrences. + signs indicate that two motifs tend to co-localize on the DNA or RNA sequences. The NF-Y and Sp1 binding sites show a significant proximal co-occurrence and co-localization in the promoters of their target genes. This co-localization is illustrated by a FIRE motif map, which shows where these two binding sites co-occur in the promoter sequences of genes in cluster 17, in comparison with genes randomly selected from clusters 75 and 47. (B) The average expression profile of genes in co-expression cluster 17, across all BL and DLBCL samples, shows a high correlation with NF-Y mRNA expression. The average expression profiles of the genes in clusters 75 and 47, although enriched in Sp1 and NF-Y putative sites respectively, are not correlated with BL vs. DLBCL classification.
Figure 5
Figure 5. Cancer pathway map
Shown are the 58 non-redundant iPAGE-discovered pathways with significant patterns of deregulation across 46 cancer vs. normal samples. Each entry in this heatmap represents the most significant over-representation of a given pathway across all non-background co-expression clusters for a given cancer. Over-representation is measured using log-transformed hypergeometric p-values. The colors indicate whether the genes in a given pathway are up-regulated (red) or down-regulated (green) in the tumor samples. The pathways discussed in the text are highlighted in yellow.
Figure 6
Figure 6. Cancer pathway-regulatory interaction map
Shown is a subset of the cis-regulatory motif-pathway associations from the cancer pathway-regulatory interaction map in Figure S4C. As in Figure 2C, red entries represent positive associations between pathways and regulatory elements.
Figure 7
Figure 7. Experimental validation of the discovered associations
(A) Genes harboring the AAAA[AGT]TT motif are up-regulated upon transfection of decoy oligonucleotides matching that sequence. (B) Transfection of AAAA[AGT]TT oligos deregulates the expression of “mitotic cell cycle”, “chromatin assembly”, and “cell-cell adhesion” genes (see also Figure S5A). (C) Knocking down Elk1 mRNA up-regulates genes in several pathways associated with the binding site of this transcription factor (see also Figure S5B). (D) Knocking down NFYA is accompanied by up-regulation in the mitotic cell cycle genes (see also Figure S5C).

Comment in

Similar articles

Cited by

References

    1. Adjei AA, Hidalgo M. Intracellular signal transduction pathway proteins as targets for cancer therapy. J Clin Oncol. 2005;23:5386–5403. - PubMed
    1. Arora KK, Pedersen PL. Functional significance of mitochondrial bound hexokinase in tumor cell metabolism. Evidence for preferential phosphorylation of glucose by intramitochondrially generated ATP. J Biol Chem. 1988;263:17422–17428. - PubMed
    1. Ashburner M, Ball CA, Blake JA, Botstein D, Butler H, Cherry JM, Davis AP, Dolinski K, Dwight SS, Eppig JT, et al. Gene ontology: tool for the unification of biology. The Gene Ontology Consortium. Nat Genet. 2000;25:25–29. - PMC - PubMed
    1. Boorsma A, Foat BC, Vis D, Klis F, Bussemaker HJ. T-profiler: scoring the activity of predefined groups of genes using gene expression data. Nucleic Acids Res. 2005;33:W592–595. - PMC - PubMed
    1. Calfon M, Zeng H, Urano F, Till JH, Hubbard SR, Harding HP, Clark SG, Ron D. IRE1 couples endoplasmic reticulum load to secretory capacity by processing the XBP-1 mRNA. Nature. 2002;415:92–96. - PubMed

Publication types

MeSH terms

Associated data