. 2010 Feb 15;338(2):226-36.
doi: 10.1016/j.ydbio.2009.12.005. Epub 2009 Dec 21.

C. elegans BED domain transcription factor BED-3 controls lineage-specific cell proliferation during organogenesis

Affiliations

C. elegans BED domain transcription factor BED-3 controls lineage-specific cell proliferation during organogenesis

Takao Inoue et al. Dev Biol. .

Abstract

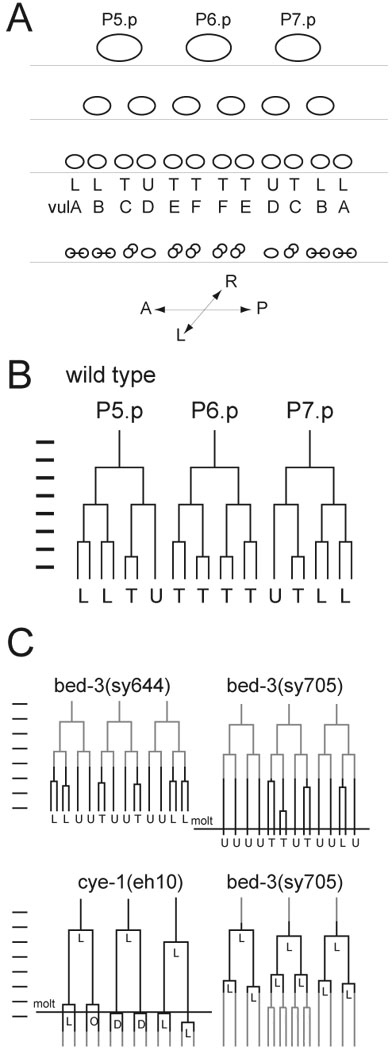
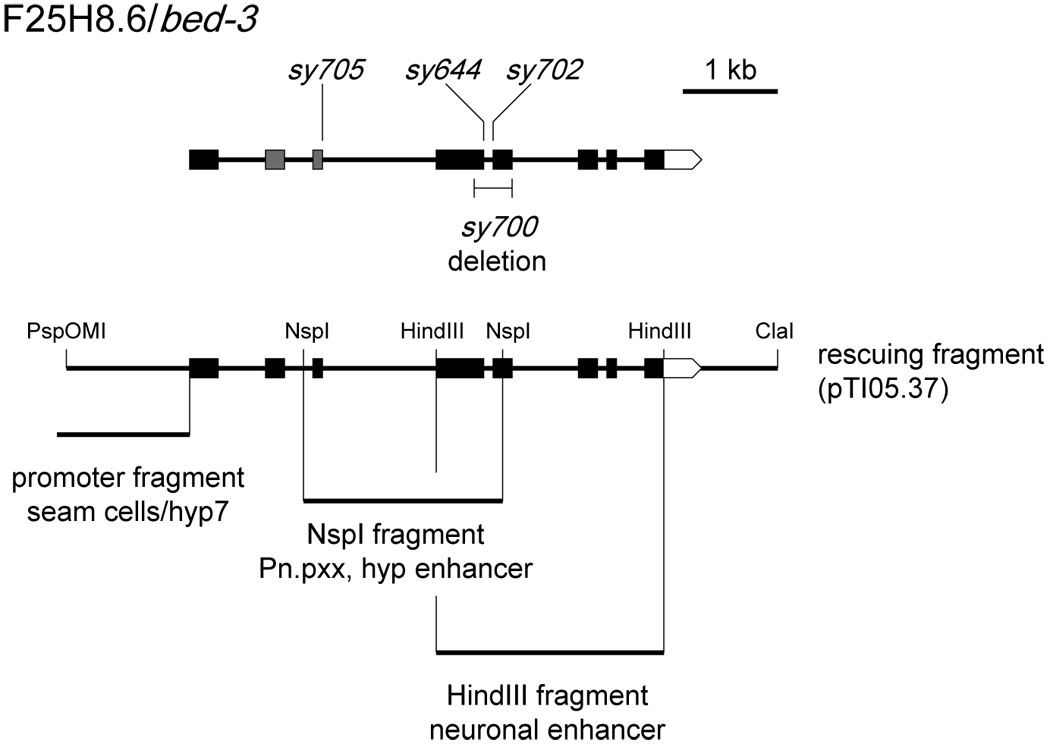
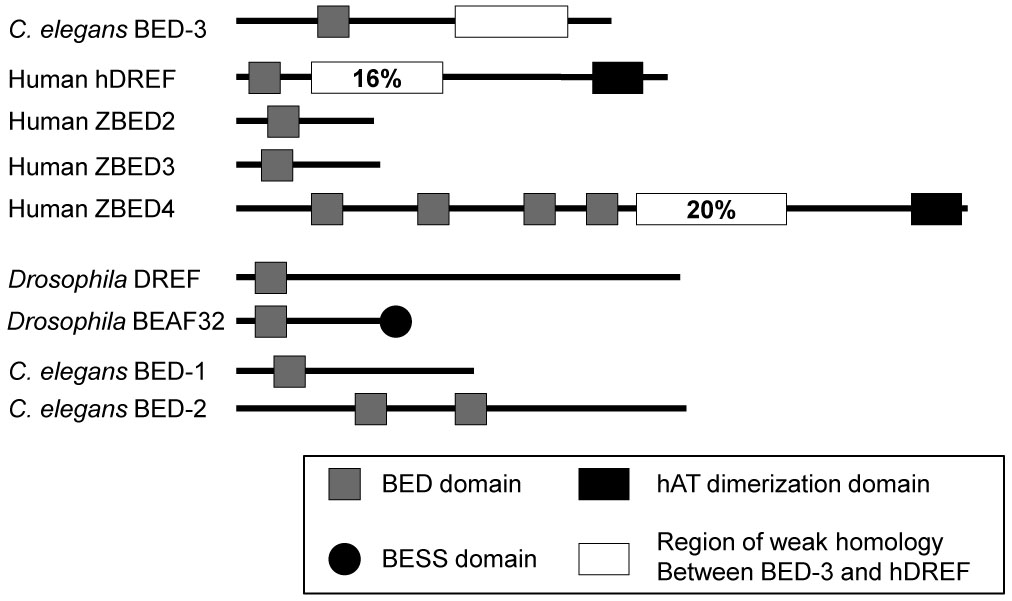
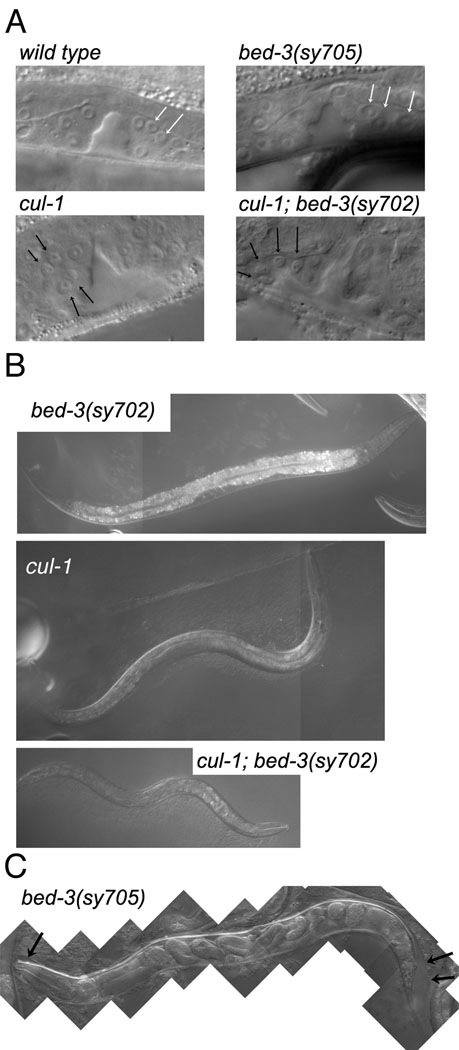
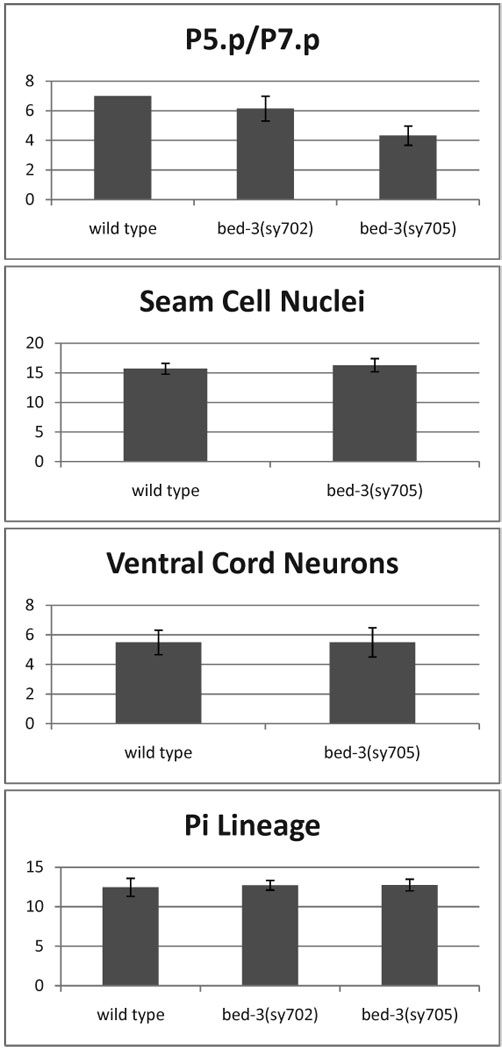
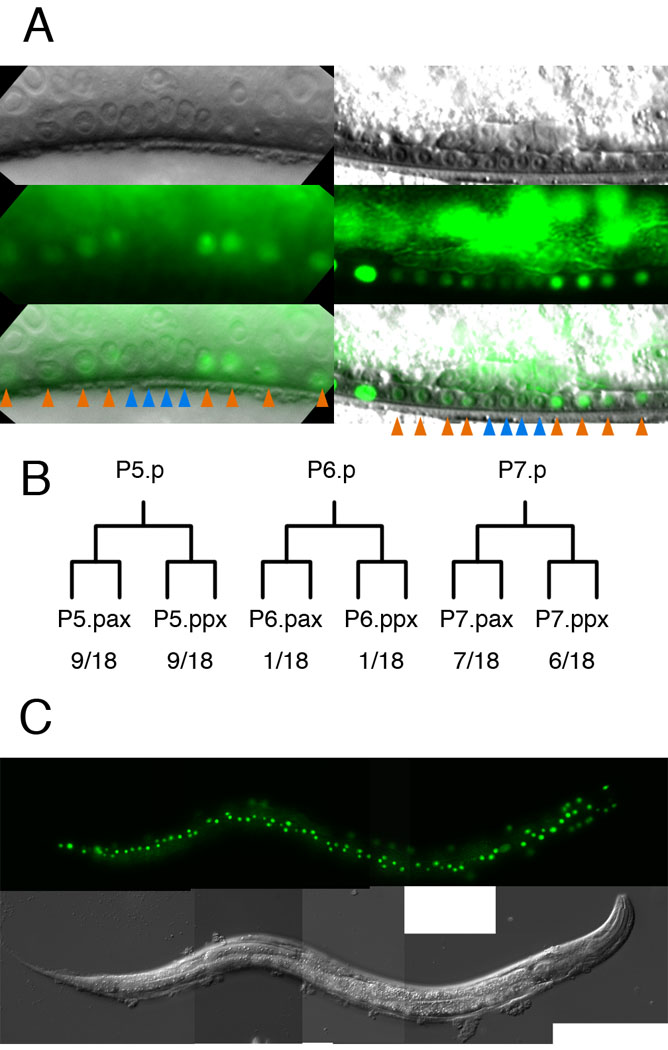
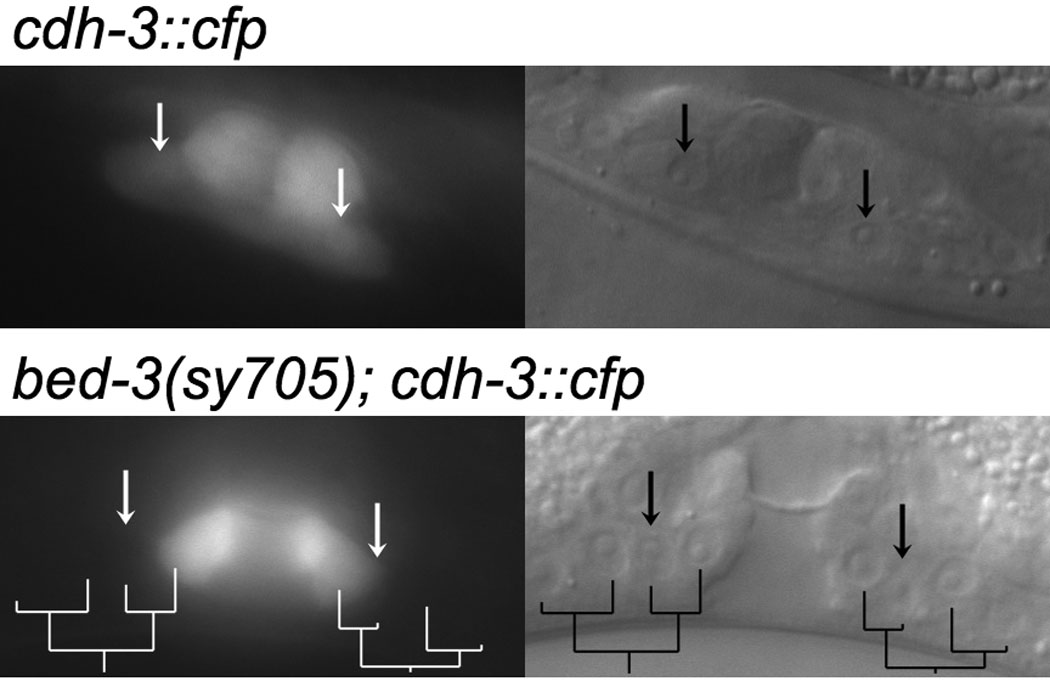
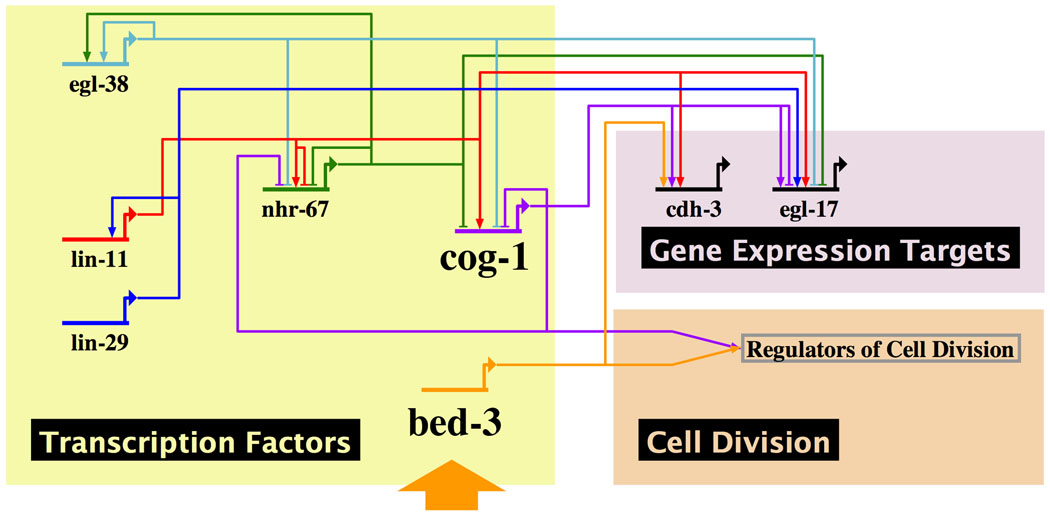
The control of cell division is critical to organogenesis, but how this control is achieved is not fully understood. We found that mutations in bed-3, encoding a BED Zn-finger domain transcription factor, confer a phenotype where a specific set of cell divisions during vulval organogenesis is lost. Unlike general cell cycle regulators in Caenorhabditis elegans, the function of bed-3 is restricted to specific lineages. Transcriptional reporters suggest that bed-3 is expressed in a limited number of cell types including vulval cells whose divisions are affected in bed-3 mutants. A bed-3 mutation also affects the expression pattern of the cdh-3 cadherin gene in the vulva. The phenotype of bed-3 mutants is similar to the phenotype caused by mutations in cog-1 (Nkx6), a component of a gene regulatory network controlling cell type specific gene expression in the vulval lineage. These results suggest that bed-3 is a key component linking the gene regulatory network controlling cell-type specification to control of cell division during vulval organogenesis.


Figures

Figure 1
Figure 1. Vulval development of C. elegans and lineage defect of bed-3 mutants
A. Arrangements of Pn.p descendant cells through three rounds of division. Ovals represent cell nuclei. First two divisions occur in anterior/posterior orientation and produce a linear array of twelve Pn.p granddaughters. The twelve cells then divide in sublineage-specific orientations (indicated by letters below: L = longitudinal (a/p), T = transverse (l/r), U = undivided). Letters A through F represent cell types produced by each Pn.p granddaughter, vulA through vulF. In general, the third round of cell division produces two cells of the same type, thus each of the twelve Pn.p granddaughters corresponds to a single cell type. The only exceptions are the cells marked by the letter "B". These divide to produce vulB1 and vulB2 cells, which exhibit distinct gene expression patterns. B. The wild-type vulval cell divisions represented as a lineage diagram. The time is plotted on the vertical axis, and markers on the left are at one hour intervals. Each branching of the inverted tree figure represents a cell division. The orientation of the terminal division is marked below each sublineage. Cells are referred to by their ancestry: The posterior daughter of P5.p is P5.pp. The anterior daughter of P5.pp is P5.ppa and so on. We use x(e.g. P5.ppx) to refer to an unspecified daughter cell, and Pn.p refers to P5.p, P6.p or P7.p. C. Top: Lineage diagrams of representative bed-3(sy644) and bed-3(sy705) mutant animals. Observations were initiated after the completion of the first two rounds of Pn.p divisions and continued until several hours after the last division. Bottom: Lineage diagrams of representative cye-1(eh10) and bed-3(sy705) animals. Observations were started before the first Pn.p division and stopped after the second round of division. Whether these cells had divided further was not determined. The observed portion of the lineage is marked by black lines. Grey lines represent portions of the lineage that were inferred based on cell size and position. The time of molting is indicated by a horizontal line across the lineage diagram. Molting was not scored in the bed-3(sy644) animal, and probably took place after all divisions were completed.
Figure 2
Figure 2. bed-3 gene structure
Top: the intron/exon structure of bed-3 and locations of mutations. The BED Zn-finger domain is encoded in second and third exons (gray). Bottom: genomic regions tested for promoter and enhancer activity. The promoter fragment, placed upstream of a gfp reporter, drives expression in seam and hyp7 cells. When placed upstream of the promoter fragment, NspI and HindIII fragments drive additional expression, demonstrating the presence of enhancer activity.
Figure 3
Figure 3. Domain structures of BED Zn-finger domain containing proteins
N-terminus is to the left. Percentages indicate amino acid identity with the homologous region of BED-3.
Figure 4
Figure 4. Phenotypes of bed-3 mutants and interaction with cul-1
A. Mid-L4 stage vulva, after cell divisions had been completed. Arrows point to vulval nuclei. Not all nuclei are in the plane of focus. However, note that bed-3 mutant nuclei are larger than in the wild type due to the lack of terminal division. In contrast, cul-1 nuclei are smaller due to extra divisions. The cul-1; bed-3 double mutant is similar to cul-1. B. Body size of bed-3(sy702), cul-1 and cul-1; bed-3(sy702) mutants. All animals are in the mid-L4 stage and shown at the same scale. bed-3(sy702) mutants are about the same size as the wild-type (not shown). bed-3(sy705) mutants are slightly smaller (not shown). C. The molting defect of bed-3(sy705). This animal is an old adult, as indicated by the presence of late stage embryos in the uterus. However, because of the molting defect, the L4 cuticle has not been shed (black arrows).
Figure 5
Figure 5. Cell numbers in various lineages
Numbers of cells produced by diverse lineages were assayed in the wild-type and bed-3 mutant backgrounds. P5.p/P7.p: Descendants of the P5.p or the P7.p lineage. Seam Cell Nuclei: The total number of seam cell nuclei (per side) in late L4 or young adult stage animals. Ventral Cord Neurons: The number of neuronal cell bodies in the ventral cord, per Pn.p-to-Pn.p interval. Pi Lineage: The number of π cell descendants in the mid-L4 stage. The counts include +1 for the anchor cell, which is also labeled by the cog-2::gfp marker used to identify π cell descendants. Error bars indicate standard deviations.
Figure 6
Figure 6. bed3::gfp expression in vulval cells
Expression of bed-3::gfp enhanced by the NspI fragment. The reporter shown (pTI05.29) expresses a nuclear localized variant of GFP. A. Nomarski, epifluorescence and combined images of two animals expressing bed-3::gfp in Pn.p granddaughters. Anterior is to the left. In the animal shown to the left, P5.p and P7.p granddaughters (orange arrows) express GFP. In the animal shown to the right, P6.p granddaughters (blue arrows) also express GFP. B. Frequencies of bed-3::gfp expression in individual Pn.p granddaughters. Because sister cells (e.g. P5.paa and P5.pap) always expressed similar levels of GFP, they were scored together. P5.pxx and P7.pxx often express bed-3::gfp, whereas expression in P6.pxx is observed less often. C. Expression of bed-3::gfp in hyp7 and seam cells.
Figure 7
Figure 7. Expression of vulval cell type marker cdh-3::cfp in bed-3(sy705) background
Corresponding Nomarski (right) and epifluorescence (left) images are shown. Top: Wild type. vulC cells are indicated by arrows. Bottom: bed-3(sy705). In this animal, P5.p and P7.p lineages divided only two rounds as shown on the lineage tree below. P5.ppa and P7.pap, which give rise to vulC in the wild type, are marked by arrows. vulC expression is lost in bed-3(sy705).
Figure 8
Figure 8. Vulval gene regulatory network regulates gene expression and cell division
Only selected genes in the network are shown. The current knowledge of the vulval gene regulatory network is such that the model is not predictive. However, it can be observed that cell division and gene expression are regulated by related, but not fully linked mechanisms. (Note, since bed-3 and cog-1 encode transcription factors, regulation of cell division is also likely to involve expression of cell-division promoting genes.) Because mutations we analyzed are not nulls, our results are also consistent with cog-1 and bed-3 (orange arrow) acting in series to regulate cell division. The network was drawn using BioTapestry Editor (http://www.biotapestry.org) (Longabaugh et al., 2009).

Similar articles

Cited by

References

    1. Alon U. An introduction to systems biology, Design principles of biological circuits. London: CRC Press, Taylor & Francis Group; 2007.
    1. Aravind L. The BED finger, a novel DNA-binding domain in chromatin-boundary-element-binding proteins and transposases. Trends Biochem Sci. 2000;25:421–423. - PubMed
    1. Brenner S. The genetics of Caenorhabditis elegans. Genetics. 1974;77:71–94. - PMC - PubMed
    1. Chang C, Newman AP, Sternberg PW. Reciprocal EGF signaling back to the uterus from the induced C. elegans vulva coordinates morphogenesis of epithelia. Current Biology. 1999;9:237–246. - PubMed
    1. Chen T, Li M, Ding Y, Zhang LS, Xi Y, Pan WJ, Tao DL, Wang JY, Li L. Identification of zinc-finger BED domain-containing 3 (Zbed3) as a novel Axin-interacting protein that activates Wnt/beta-catenin signaling. J Biol Chem. 2009;284:6683–6689. - PMC - PubMed

Publication types

Substances

LinkOut - more resources