. 2010 Feb 5;584(3):619-24.
doi: 10.1016/j.febslet.2009.12.011. Epub 2009 Dec 17.

Sharp-1 modulates the cellular response to DNA damage

Affiliations

Sharp-1 modulates the cellular response to DNA damage

Jian-Jun Liu et al. FEBS Lett. .

Abstract

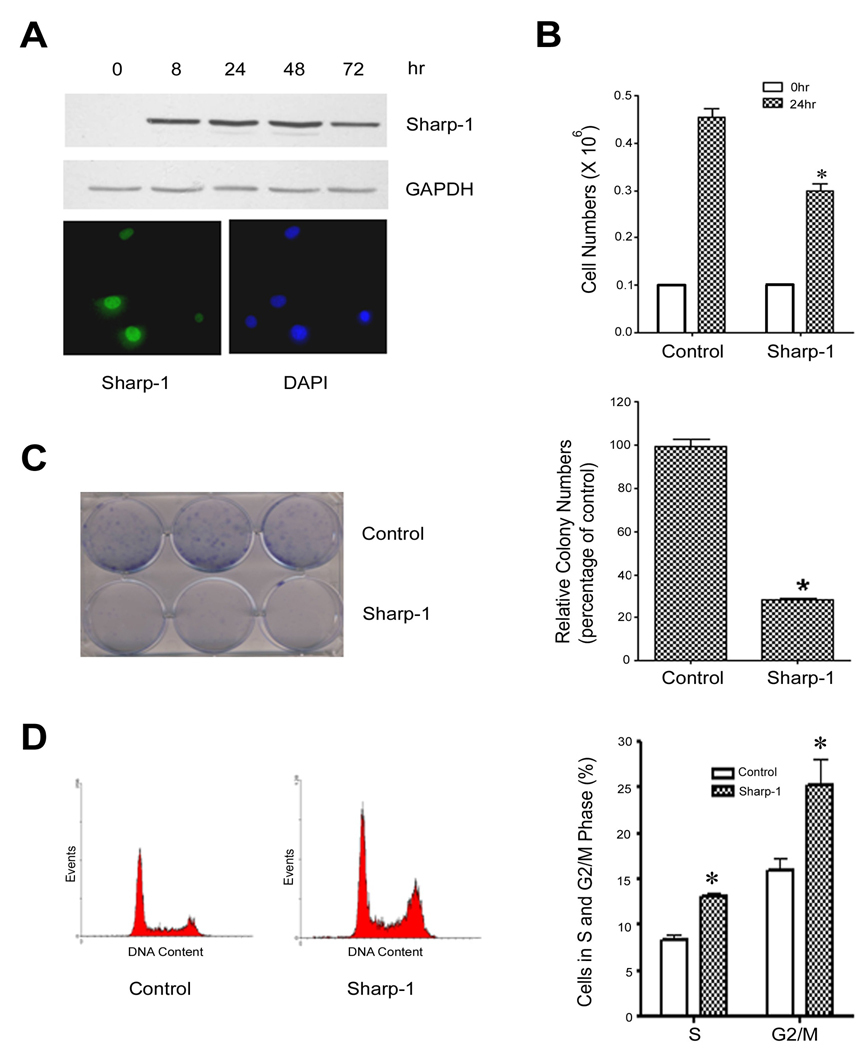
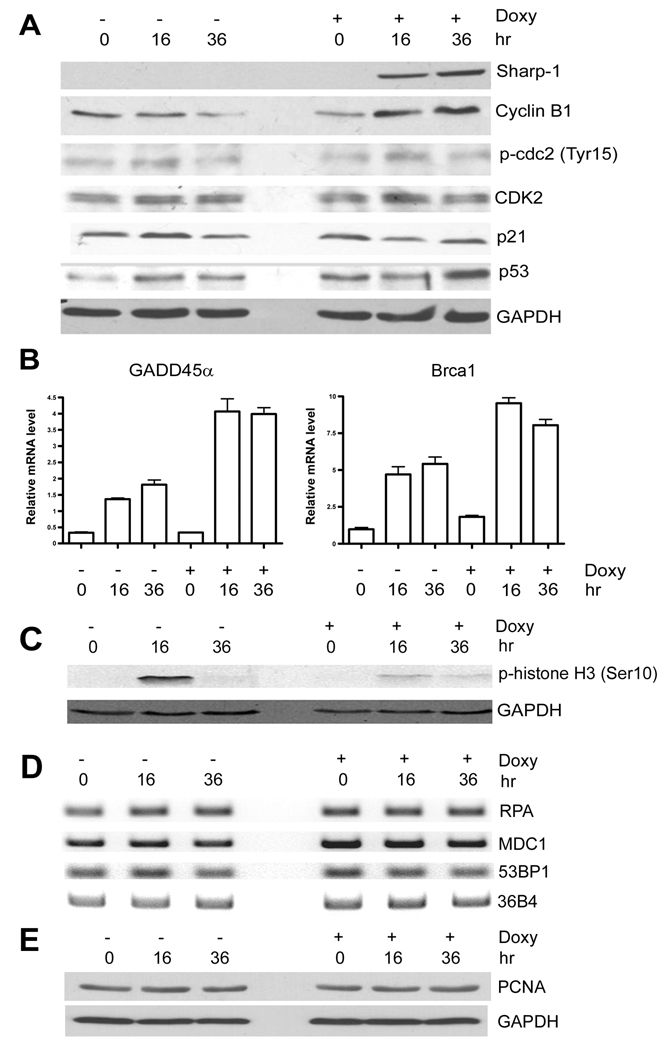
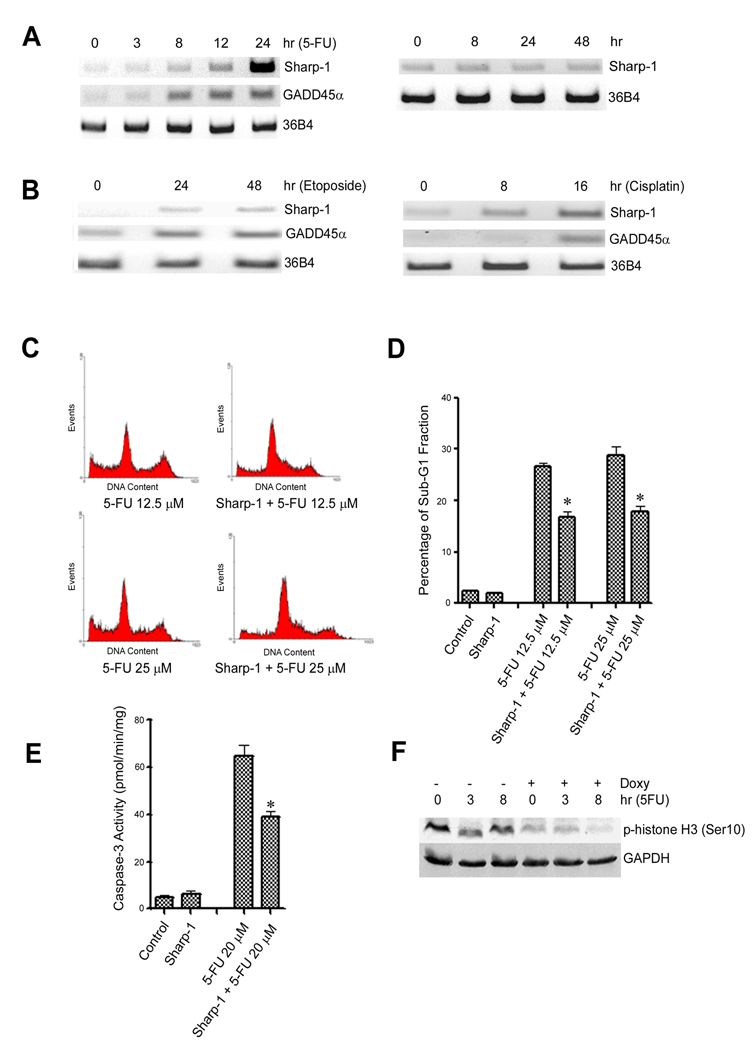
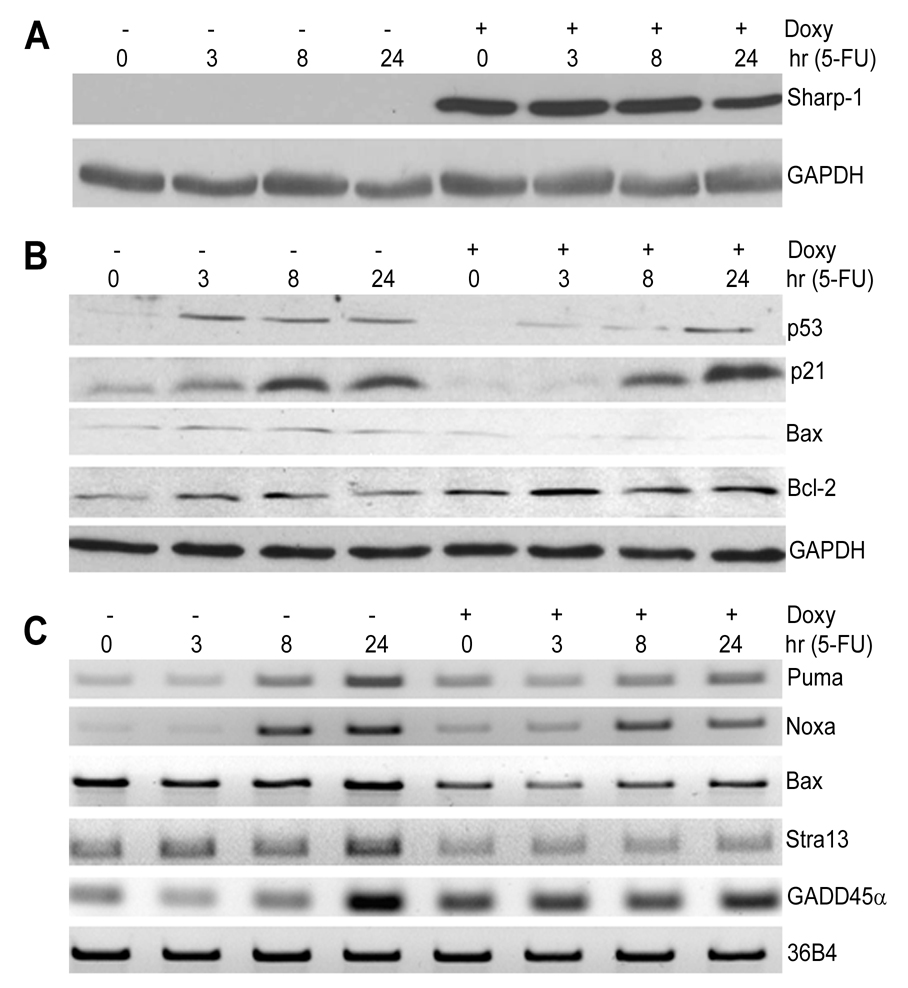
DNA damage checkpoints are essential for maintenance of genome integrity. We report here that inducible overexpression of the transcription factor Sharp-1 results in an S and G2/M cell cycle arrest, concomitant with the upregulation of Brca1 and GADD45alpha expression. In addition, we show that endogenous Sharp-1 mRNA is increased by DNA-damaging agents. Consistently, Sharp-1 overexpressing cells exhibit reduced apoptosis in response to chemotherapeutic drugs along with lower p53 expression and activity. Our studies identify a novel function for Sharp-1 in cell cycle arrest and DNA damage-induced apoptosis. Inappropriate Sharp-1 expression may therefore be associated with tumorigenesis.


Figures

Figure 1
Figure 1. Sharp-1 causes cell cycle arrest
(A) Sharp-1 expression was induced with doxycycline for 0–72hr and analyzed by western blot using anti-myc antibody. GAPDH was used as a loading control. Cells were immunostained 24 hr after doxycline treatment and analyzed by fluorescence microscopy. Nuclei were stained with DAPI (lower panel). (B) Cells were plated in triplicates at a density of 0.1×10⁶ and left untreated (control) or treated with doxycycline (Sharp-1). 24 hr later, cell numbers were counted by trypan blue assay. Error bars indicate mean ± standard error (SE). (C) NIH3T3 cells without or with doxycycline treatment were cultured at a low density for 10 days, and colonies were stained with crystal violet. The panel on the left shows representative plates from two independent experiments. For quantification, the dye was extracted and the absorbance read at 570nm (right). Sharp-1 expressing cells showed a significant reduction in colony formation (*p<0.05). (D) Control and cells treated with doxycycline (24 hr) were analyzed by FACS. The left panel show representative histograms of cell cycle profiles in cells without (control) and with Sharp-1 overexpression. Quantification (right panel) of the percentage cells undergoing S and G2 arrest indicated a significant increase in Sharp-1 over-expressing cells compared to controls (*p<0.05). Results are mean ± SE from 4 independent experiments.
Figure 2
Figure 2. Sharp-1 induces GADD45α and Brca1 expression
(A) Cells were left untreated (−) or treated with doxycycline (+ Doxy) for 16 and 36 hr. Sharp-1, cyclin B1, phosphorylated cdc2 (Tyr 15), CDK2, p21waf/cip1 and p53 were analyzed by western blot. (B) GADD45α and Brca1 mRNA was analyzed by quantitative RT-PCR. GAPDH was used as an internal control. (C). The level of the mitotic marker H3 (ser 10) was determined before after doxycycline treatment by western blot. (D) Expression of RPA, 53BP1, and MDC1 was analyzed by RT-PCR. The results are representative of two independent experiments. (E) PCNA and GAPDH levels were analyzed by western blot.
Figure 3
Figure 3. Sharp-1 is up-regulated by DNA-damaging stimuli and inhibits apoptosis
(A). NIH3T3 cells were treated with 30 µM 5FU for 0, 3, 8, 12 and 24 hr. Sharp-1 and GADD45α expression was analyzed by RT-PCR. 36B4 was used as an internal control (left panel). Sharp-1 mRNA was examined in cells cultured for various time points by RT-PCR (right panel) (B). NIH3T3 cells were treated with 2 µM etoposide or 20 µM cisplatin for 0, 24 and 48 hr or 0, 8 and 16 hr, respectively. Sharp-1 and GADD45α expression was analyzed by RT-PCR. (C) NIH3T3 cells were pre-treated with doxycycline for 8 hr to induce Sharp-1, and were then co-treated with 12.5 µM or 25 µM 5FU for 72 hr. Representative histograms of cell cycle profiles without and with Sharp-1 overexpression are shown. (D) The percentage of sub-G1 fraction in cells treated with 5-FU in the absence and presence of Sharp-1 overexpression was determined. Sharp-1 overexpression resulted in a significant decrease (*p<0.05) in the percentage of apoptotic cells. Error bars indicate mean ± SE. (E). Caspase-3 activity was determined in control and Sharp-1 expressing cells under conditions described in (C). Sharp-1 expressing cells exhibited a significant (*p<0.05) decrease in caspase-3 activity compared to controls. (F). Control and doxycycline induced cells (16 hr) were treated with 5-FU and phospho H3 (ser10) levels was determined.
Figure 4
Figure 4. Sharp-1 inhibits expression of pro-apoptotic p53 targets
(A,B). Cells were left untreated (−) or induced with doxycycline (+) for 16 hr prior to addition of 15 µM 5-FU for 0, 3, 8 and 24 hr. Sharp-1, p53, p21, Bax, and Bcl2 were analyzed by western blot. (C). The expression of Noxa, Puma, Bax, Stra13 and GADD45α was analyzed by RT-PCR in control and doxycycline induced cells after various time points of 5-FU treatment as indicated.

Similar articles

Cited by

References

    1. Bartek J, Lukas J. DNA damage checkpoints: from initiation to recovery or adaptation. Curr Opin Cell Biol. 2007;19:238–245. - PubMed
    1. Motoyama N, Naka K. DNA damage tumor suppressor genes and genomic instability. Curr Opin Genet Dev. 2004;14:11–16. - PubMed
    1. Zhou BB, Elledge SJ. The DNA damage response: putting checkpoints in perspective. Nature. 2000;408:433–439. - PubMed
    1. Meek DW. Tumor suppression by p53: a role for the DNA damage response? Nat Rev Cancer. 2009;9:714–723. - PubMed
    1. Taylor WR, Stark GR. Regulation of the G2/M transition by p53. Oncogene. 2001;20:1803–1815. - PubMed

Publication types

MeSH terms