. 2010 Apr 21;263(4):393-406.
doi: 10.1016/j.jtbi.2009.11.024. Epub 2009 Dec 16.

A 2D mechanistic model of breast ductal carcinoma in situ (DCIS) morphology and progression

Affiliations

A 2D mechanistic model of breast ductal carcinoma in situ (DCIS) morphology and progression

Kerri-Ann Norton et al. J Theor Biol. .

Abstract

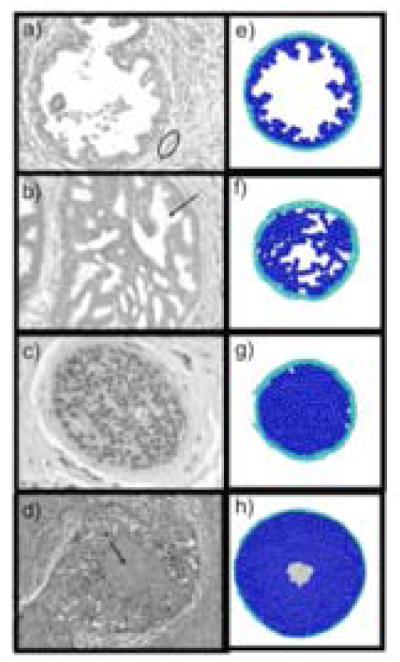
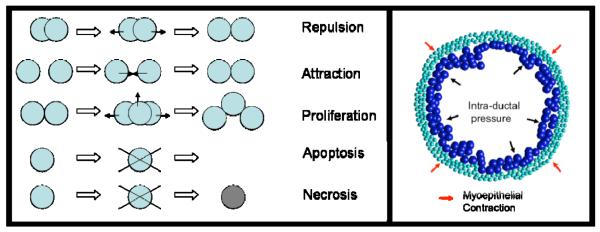
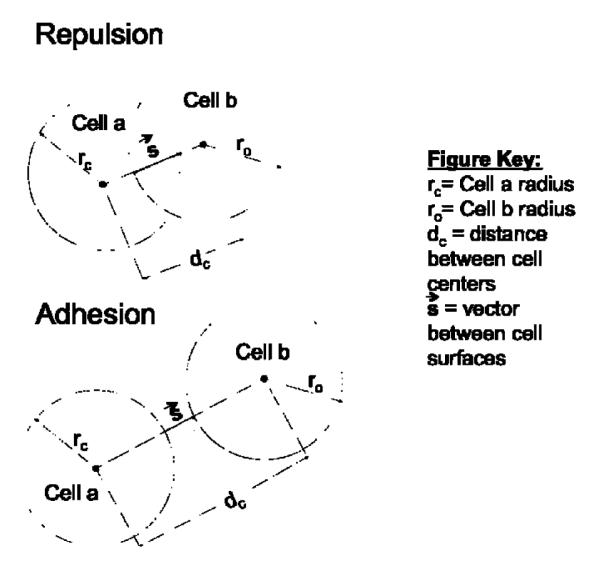
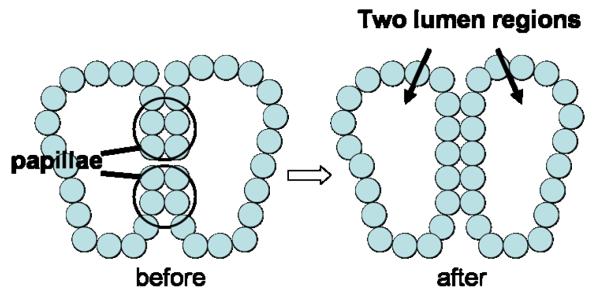
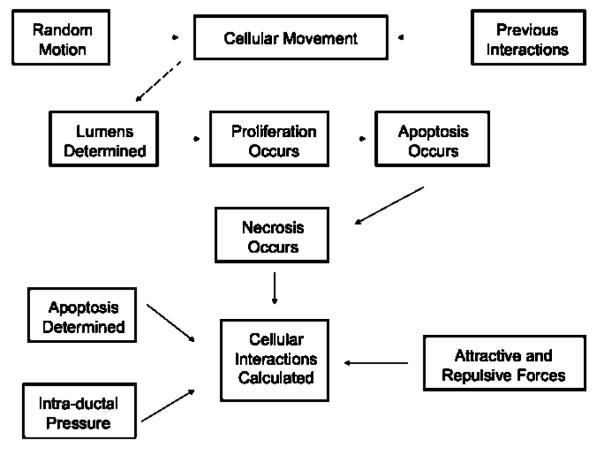
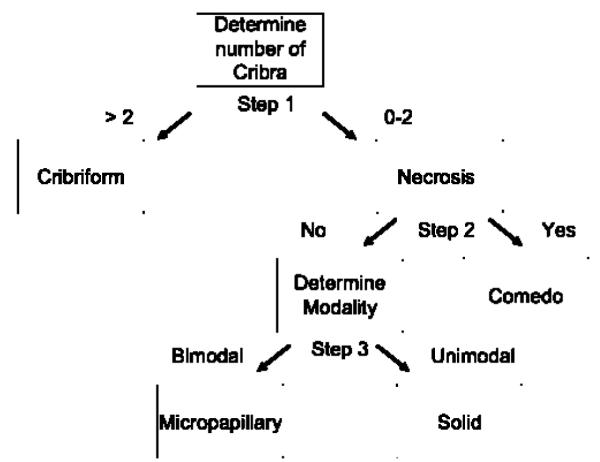
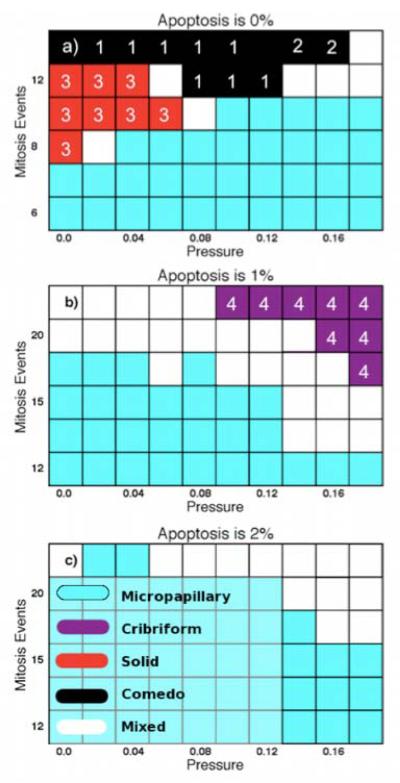
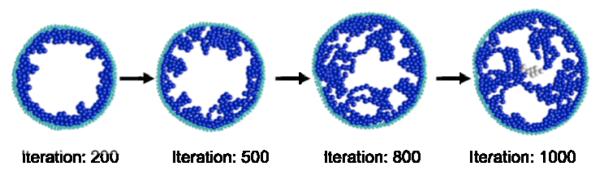
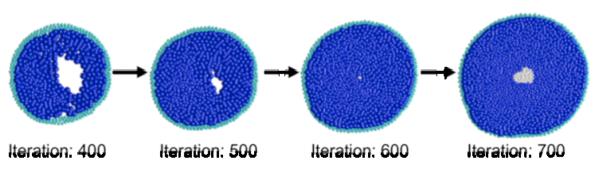
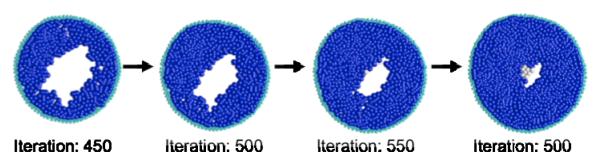
Ductal carcinoma in situ (DCIS) of the breast is a non-invasive tumor in which cells proliferate abnormally, but remain confined within a duct. Although four distinguishable DCIS morphologies are recognized, the mechanisms that generate these different morphological classes remain unclear, and consequently the prognostic strength of DCIS classification is not strong. To improve the understanding of the relation between morphology and time course, we have developed a 2D in silico particle model of the growth of DCIS within a single breast duct. This model considers mechanical effects such as cellular adhesion and intra-ductal pressure, and biological features including proliferation, apoptosis, necrosis, and cell polarity. Using this model, we find that different regions of parameter space generate distinct morphological subtypes of DCIS, so elucidating the relation between morphology and time course. Furthermore, we find that tumors with similar architectures may in fact be produced through different mechanisms, and we propose future work to further disentangle the mechanisms involved in DCIS progression.


Figures

Figure 1
Figure 1
Histologies of human ductal carcinoma in situ biopsy specimens (left), alongside corresponding structures from our in silico simulations (right). Panels (a) & (e) show “micropapillary” structures. In the simulations, the duct is surrounded by myoepithelial cells (green) that constrain the growth of the epithelial cells (blue). The myoepithelium is identified in (a) as the circled region. Panels (b) & (f) show the “cribriform” morphology; exemplar cribrum identified in (b) by arrow. Panels (c) & (g) show “solid” tumors, where the entire ductal lumen is filled with proliferating cells, and panels (d) & (h) show the “comedo” morphology, in which a central region, deprived of nutrients, undergoes necrosis. These necrotic cells are identified by the arrow in (d) and are shown in gray in (h). The in vivo cross-sections were classified by subtype by pathologist Dr. N. Barnard, after being acquired by biopsy, stained with Hematoxylin & Eosin (H&E), embedded into paraffin, sliced, and imaged. In the simulation, the “micropapillary” structure was formed at iteration 500 with an apoptotic rate of 1%, intra-ductal pressure of 0.14, mitosis every 50 iterations (see text for details). The “cribriform” structure was formed at iteration 700 with an apoptotic rate of 1%, intra-ductal pressure of 0.02, mitosis every 30 iterations. The “solid” tumor formed at iteration 700 with no apoptosis, no pressure and mitosis occurring every 88 iterations. Lastly, the “comedo” structure formed at iteration 700, with no apoptosis, intra-ductal pressure of 0.06 and mitosis occurring every 50 iterations.
Figure 2
Figure 2
Model Elements. In the left panel, we show representations of repulsion, attraction, proliferation, apoptosis and necrosis used in the model. The solid arrows on the cells indicate forces, and the Xs denote cell death. In apoptotic cell death, the cell is completely removed from the simulation whereas in necrotic cell death, debris is left behind that occupies space. The larger open arrows represent transitions over time. In the right panel, we show the counteracting influences of outward intra-ductal pressure (black arrows) and inward myoepithelial contraction (red arrows) on the epithelial layer.
Figure 3
Figure 3
Cellular Repulsion and Adhesion. We calculate the forces on cell a due to repulsion using a spring-dashpot model, such that the net force equals ks –βvo, where k is the spring constant, s is defined as above, β is the damping coefficient and vo, is the cell velocity. The acceleration on cell a due to adhesion is calculated simply the attraction strength (homotypic or heterotypic attraction constants) multiplied by s, the attractive force (see Appendix E A2).
Figure 4
Figure 4
Microlumen Formation. When two papillae, separated along a monolayer by 10 or more cells, come within 1 cell diameter from one other, the cells are attached by reordering cell positions so that they form new adhesions with the nearby papillae, thus forming two separate lumen regions (or “microlumens”), in which mitosis and pressure are calculated separately.
Figure 5
Figure 5
Overview of the simulation program executed at each time step. Cell motion is implemented first using random additions to cell velocities, and interactions calculated from the cell positions from the previous time step. The program then checks whether microlumens should be formed and, if so, assigns the cells into separate microlumens in which pressure and mitosis are implemented separately. Next, mitosis is implemented, followed by apoptosis, and finally, necrosis. Cellular interactions (attractive and repulsive forces and intra-ductal pressure) are then calculated for the next iteration, and the cells chosen for apoptosis are identified. The cell locations are then logged for plotting, and the cycle repeats.
Figure 6
Figure 6
Overview of decision tree classifier used to identify morphological subtype. First the number of cribra are determined (1), if there are more than 2 cribra the specimen is classified as cribriform. Afterwards, the presence of necrotic cells is established (2). If there are necrotic cells, the specimen is classified as comedo. Lastly, the modality of the distribution of binned cells across 100 random line segments is determined (3). Modality is illustrated in Fig. 6. If the distribution is uni-modal, the figure is classified as solid. If the distribution is bi-modal, it is classified as micropapillary. (See text for details)
Figure 7
Figure 7
Classification of DCIS subtypes by cell distribution. Top: cell centers are identified, the centroid is calculated, and boxes are placed radially through the centroid at random orientations. Middle: cell densities are calculated in such 100 boxes. Bottom: these 100 densities are ensemble averaged to yield either uni- or bi-modal distributions. Note that micropapillary (far left) and comedo (far right) patterns produce bi-modal distributions, while filled cribriform (center left) and solid (center right) patterns produce uni-modal distributions.
Figure 8
Figure 8
Characterizations of simulated DCIS subtypes as functions of apoptosis rate, proliferation rate, and intra-ductal pressure. Note that an ordinate of 20 means that mitosis occurs 20 times over the 600 computational iterations over which the simulation was run. White regions indicate multiple co-existing patterns. The numbers shown indicate the locations of the different progressions that were found, see Table 1 for further explanation. a) State space with apoptosis of 0%. Notice that, as expected, without apoptosis and with moderately high mitosis rates and low pressure (upper left), solid tumors predominate, becoming comedo at very high mitosis rates. At lower mitosis rates and higher intra-ductal pressures, the duct is enlarged by the applied pressure, causing the solid morphology to become micropapillary. b) State space with apoptosis of 1%. In this case, for sufficiently rapid mitosis, cribriform tumors are able to grow when the pressure or mitosis events are moderately high. c) State space with apoptosis of 2%, at which micropapillary tumors predominate. Mixed tumors arise at very high mitosis rates, and cribriform patterns arise at very high pressure and mitosis rates. At higher apoptosis and lower proliferation rates, only micropapillary morphologies survive, as cells within other structures are literally killed off.
Figure 9
Figure 9
A time progression from micropapillary to cribriform with necrosis. At iteration 200 through 400 the state is micropapillary, at iteration 500-600 it is cribriform and at iteration 700 it becomes cribriform with central necrosis. In this simulation, the apoptosis rate is 1%, the pressure is 0.16 computational units, and mitosis occurs every 30 iterations.
Figure 10
Figure 10
A time progression from solid to comedo. At iteration 400 the state is micropapillary, at iteration 500 it becomes a non-filled solid, at iteration 600 it is solid and by iteration 700 the state is comedo. In this simulation, the apoptosis rate was 0%, the pressure was 0.04 computational units, and mitosis occurred every 50 iterations.
Figure 11
Figure 11
A time progression from micropapillary to comedo. At iteration 200, the state is micropapillary, at iteration 300 and 400 there is continued growth, and by iteration 500, the state is comedo. In this simulation, the apoptosis rate is 0%, the pressure is 0.12 computational units, and mitosis occurs every 50 iterations.

Similar articles

Cited by

References

    1. Alarcón T, Byrne H, Maini P. A cellular automaton model for tumour growth in an inhomogeneous environment. Journal of Theoretical Biology. 2003;225:257–274. - PubMed
    1. Allred DC, Wu Y, Mao S, Nagtegaal ID, Lee S, Perou CM, Mohsin SK, O’Connell P, Tsimelzon A, Medina D. Ductal carcinoma in situ and the emergence of diversity during breast cancer evolution. Clin Cancer Res. 2008;14:370–8. - PubMed
    1. Ambrosi D, Mollica F. On the mechanics of a growing tumor. Int J Eng Sci. 2002;40:1297–1316.
    1. Anderson A, Weaver A, Cummings P, Quaranta V. Tumor morphology and phenotypic evolution driven by selective pressure from the microenvironment. Cell. 2006;127:905–915. - PubMed
    1. Anderson AR, Quaranta V. Integrative mathematical oncology. Nat Rev Cancer. 2008;8:227–34. - PubMed

Publication types