. 2010 Nov 15;53(3):1135-46.
doi: 10.1016/j.neuroimage.2009.12.028. Epub 2009 Dec 16.

Cortical thickness or grey matter volume? The importance of selecting the phenotype for imaging genetics studies

Affiliations

Cortical thickness or grey matter volume? The importance of selecting the phenotype for imaging genetics studies

Anderson M Winkler et al. Neuroimage. .

Abstract

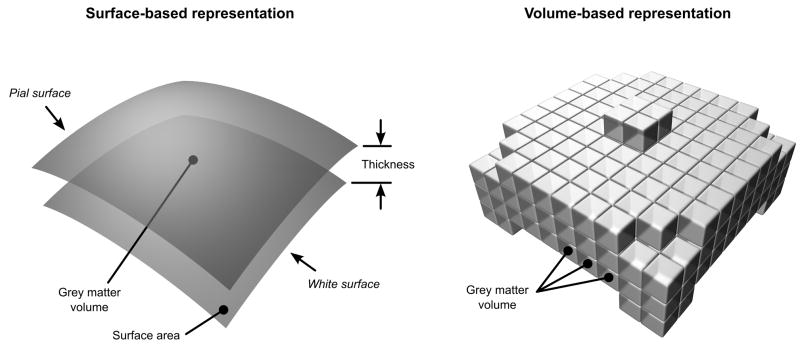
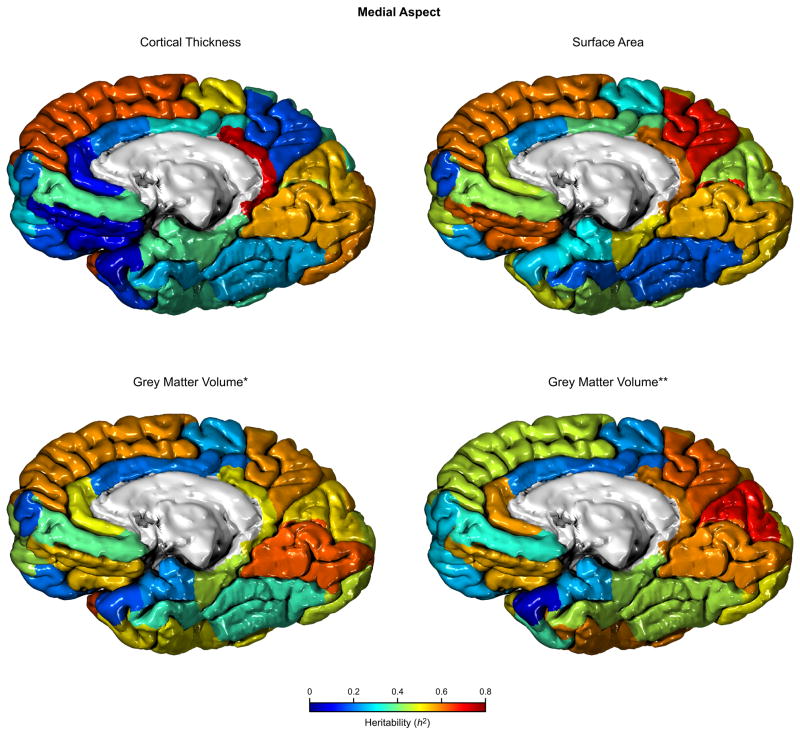
Choosing the appropriate neuroimaging phenotype is critical to successfully identify genes that influence brain structure or function. While neuroimaging methods provide numerous potential phenotypes, their role for imaging genetics studies is unclear. Here we examine the relationship between brain volume, grey matter volume, cortical thickness and surface area, from a genetic standpoint. Four hundred and eighty-six individuals from randomly ascertained extended pedigrees with high-quality T1-weighted neuroanatomic MRI images participated in the study. Surface-based and voxel-based representations of brain structure were derived, using automated methods, and these measurements were analysed using a variance-components method to identify the heritability of these traits and their genetic correlations. All neuroanatomic traits were significantly influenced by genetic factors. Cortical thickness and surface area measurements were found to be genetically and phenotypically independent. While both thickness and area influenced volume measurements of cortical grey matter, volume was more closely related to surface area than cortical thickness. This trend was observed for both the volume-based and surface-based techniques. The results suggest that surface area and cortical thickness measurements should be considered separately and preferred over gray matter volumes for imaging genetic studies.


Figures

Figure 1
Figure 1
Geometrical relationship between cortical thickness, surface area and grey matter volume. In the surface-based representation, the grey matter volume is a quadratic function of distances in the surfaces and a linear function of the thickness. In the volume-based representation, only the volumes can be measured directly and require partial volume-effects (not depicted) to be considered.
Figure 2
Figure 2
The 34 cortical regions of the Desikan et al. (2006) atlas. Some regions are buried inside sulci and cannot be fully observed.
Figure 3
Figure 3
Correlations between global measurements. Each point represents a pair of measurements for each subject. R2 is the variance explained by a linear regression model. The significances are shown on Table 2. * Measurement in the surface-based representation. ** Measurement in the volume-based representation.
Figure 4
Figure 4
Heritability (h2) for the cortical regions using different traits, lateral aspect. * Measurement in the surface-based representation. ** Measurement in the volume-based representation.
Figure 5
Figure 5
Heritability (h2) for the cortical regions using different traits, medial aspect. * Measurement in the surface-based representation. ** Measurement in the volume-based representation.

References

    1. Acosta O, Bourgeat P, Zuluaga MA, Fripp J, Salvado O, Ourselin S Alzheimer’s Disease Neuroimaging Initiative. Automated voxel-based 3D cortical thickness measurement in a combined Lagrangian-Eulerian PDE approach using partial volume maps. Med Image Anal. 2009;13:730–43. - PMC - PubMed
    1. Aganj I, Sapiro G, Parikshak N, Madsen SK, Thompson PM. Measurement of cortical thickness from MRI by minimum line integrals on soft-classified tissue. Hum Brain Mapp. 2009;30:3188–99. - PMC - PubMed
    1. Allison DB, Neale MC, Zannolli R, Schork NJ, Amos CI, Blangero J. Testing the robustness of the likelihood-ratio test in a variance-component quantitative-trait loci-mapping procedure. Am J Hum Genet. 1999;65:531–44. - PMC - PubMed
    1. Almasy L, Blangero J. Multipoint quantitative-trait linkage analysis in general pedigrees. Am J Hum Genet. 1998;62:1198–211. - PMC - PubMed
    1. Almasy L, Blangero J. Contemporary model-free methods for linkage analysis. Adv Genet. 2008;60:175–93. - PubMed

Publication types