. 2010 Mar;50(1):81-98.
doi: 10.1016/j.neuroimage.2009.12.011. Epub 2009 Dec 16.

Time-frequency dynamics of resting-state brain connectivity measured with fMRI

Affiliations

Time-frequency dynamics of resting-state brain connectivity measured with fMRI

Catie Chang et al. Neuroimage. 2010 Mar.

Abstract

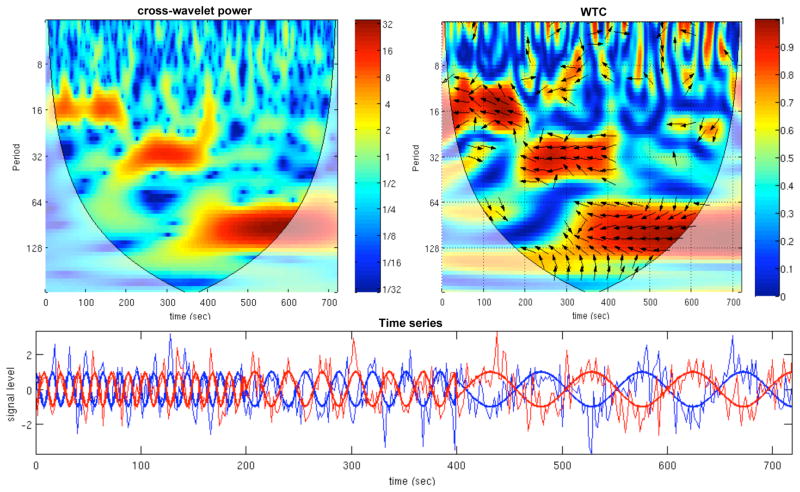
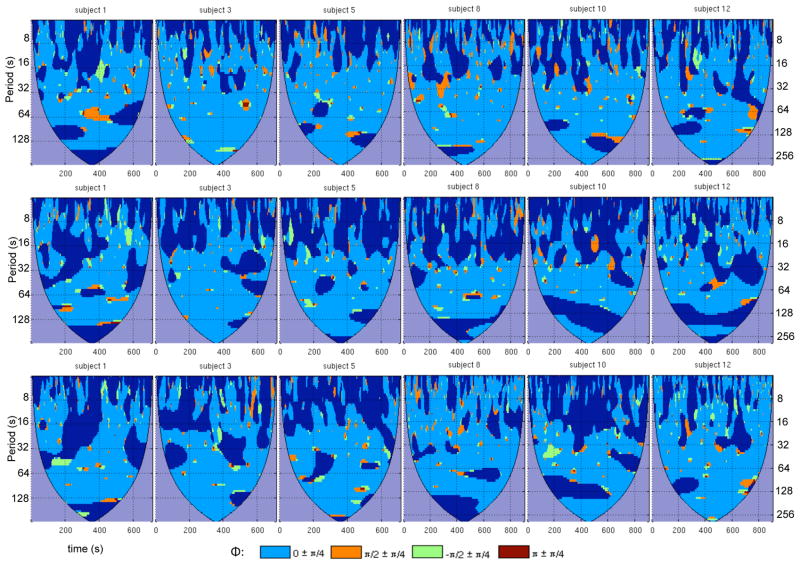
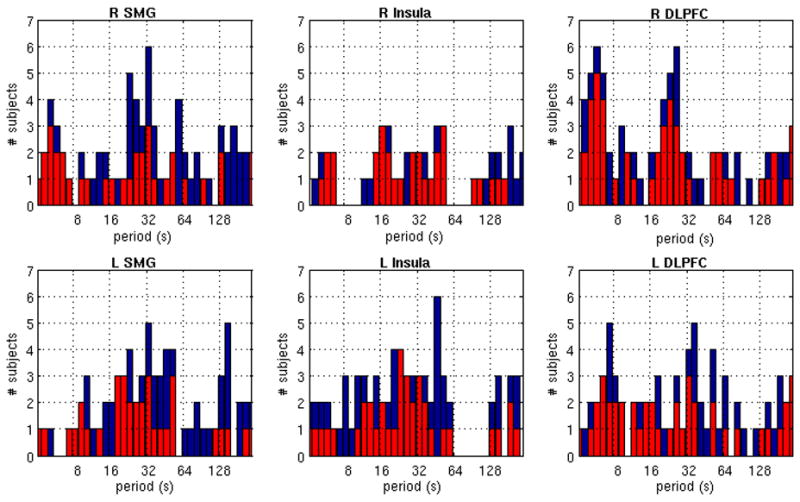
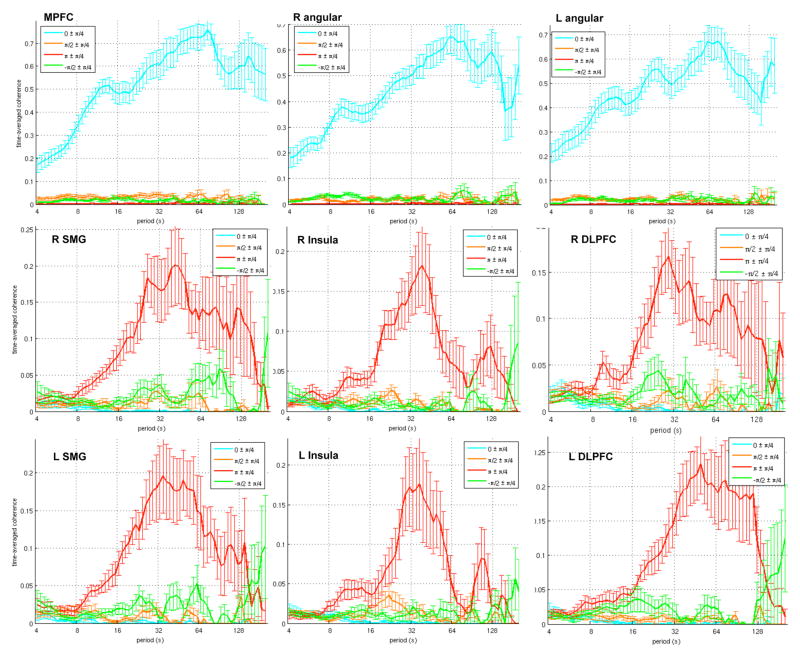
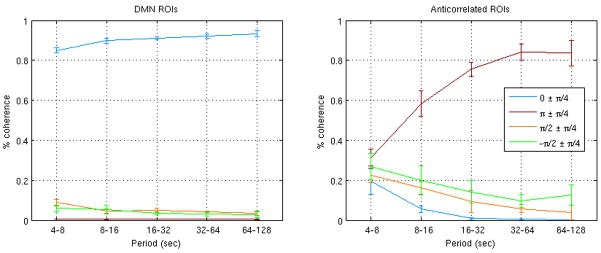
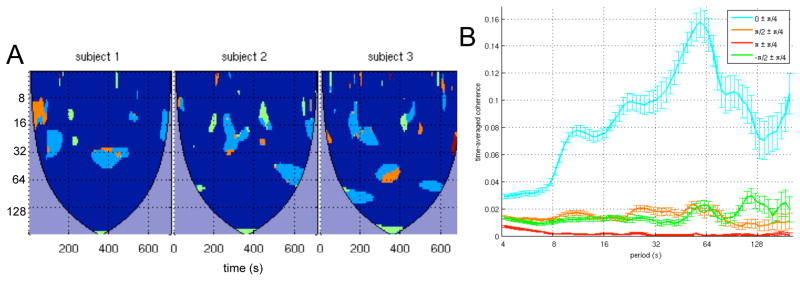
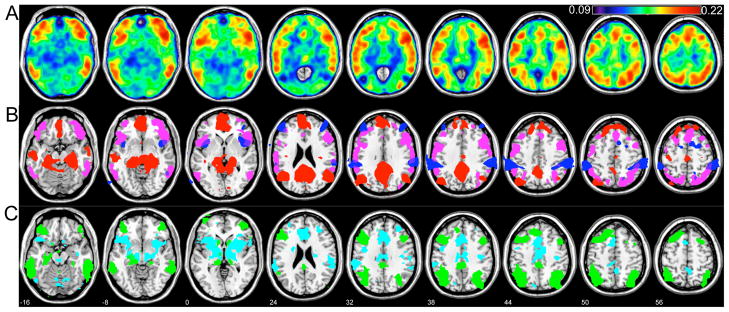
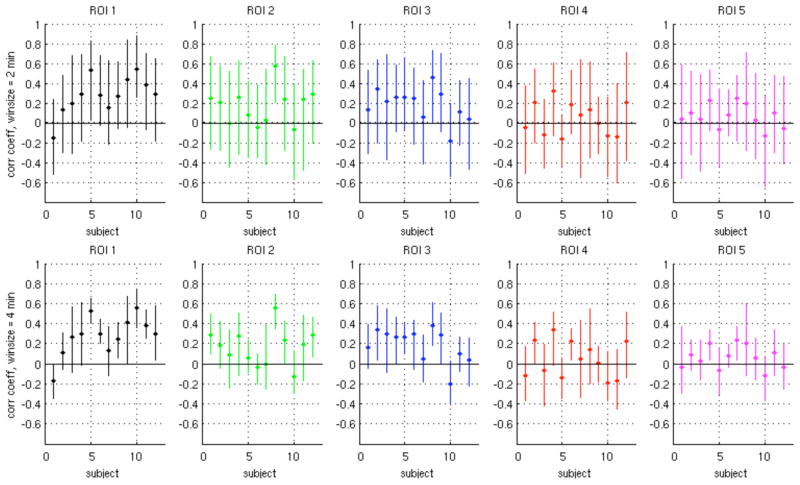
Most studies of resting-state functional connectivity using fMRI employ methods that assume temporal stationarity, such as correlation and data-driven decompositions computed across the duration of the scan. However, evidence from both task-based fMRI studies and animal electrophysiology suggests that functional connectivity may exhibit dynamic changes within time scales of seconds to minutes. In the present study, we investigated the dynamic behavior of resting-state connectivity across the course of a single scan, performing a time-frequency coherence analysis based on the wavelet transform. We focused on the connectivity of the posterior cingulate cortex (PCC), a primary node of the default-mode network, examining its relationship with both the "anticorrelated" ("task-positive") network as well as other nodes of the default-mode network. It was observed that coherence and phase between the PCC and the anticorrelated network was variable in time and frequency, and statistical testing based on Monte Carlo simulations revealed the presence of significant scale-dependent temporal variability. In addition, a sliding-window correlation procedure identified other regions across the brain that exhibited variable connectivity with the PCC across the scan, which included areas previously implicated in attention and salience processing. Although it is unclear whether the observed coherence and phase variability can be attributed to residual noise or modulation of cognitive state, the present results illustrate that resting-state functional connectivity is not static, and it may therefore prove valuable to consider measures of variability, in addition to average quantities, when characterizing resting-state networks.


Figures

Figure 1
Figure 1
Group-level thresholded t-maps for positive (red) and negative (blue) correlations with the PCC. Clusters are labeled according to Table 1.
Figure 2
Figure 2
Example of the cross-wavelet power (above left) and wavelet transform coherence (above right) for simulated data (bottom). The simulated data consist of negatively-correlated sinusoids with piecewise frequency content (f = 1/16 Hz for 0
Figure 3
Figure 3
Wavelet transform coherence between the PCC and 3 of its anticorrelated ROIs, shown for 6 subjects: (top row) right SMG, (middle row) right insula, and (bottom row) right DLPFC. For each WTC map, time is on the x-axis and scale (Fourier period) is on the y-axis. Maps have been thresholded to include only regions that were significant at 95% confidence based on Monte Carlo tests. Colors indicate ranges of the wavelet coherence phase. A phase difference of 0 indicates positive correlation; π indicates negative correlation; π/2 indicates that the PCC ROI leads the anticorrelated ROI; −π/2 indicates that the anticorrelated ROI leads the PCC ROI. Regions of insignificant coherence appear in dark blue, and areas inside the cone of influence are in purple.
Figure 4
Figure 4
Wavelet transform coherence between the PCC and default-mode ROIs, shown for 6 subjects: (top row) MPFC, (middle row) right angular gyrus, (bottom row) left angular gyrus. For further detail, please refer to the caption of Fig. 3.
Figure 5
Figure 5
Significance of temporal variability in the wavelet transform coherence. Each plot shows the number of subjects for which the variance in the WTC between the PCC and the indicated ROI exceeded the 90% (blue) and 95% (red) confidence levels, for each wavelet scale (Fourier period).
Figure 6
Figure 6
Time-averaged coherence (see Eq. 4), shown for default-mode (top row) and anticorrelated (middle and bottom rows) ROIs. Thick lines represent the mean across subjects (N=12), and error bars represent standard error.
Figure 7
Figure 7
Percentage of the total significant coherence occurring within each phase range (φ±π/4), within each of 5 different frequency bands. Lines and error bars represent the mean±SD, respectively, across the 3 DMN ROIs (left) and 6 anticorrelated ROIs (right).
Figure 8
Figure 8
(A) WTC analysis and (B) time-averaged coherence between the PCC ROI and voxels in the MPFC having an overall correlation coefficient with the same approximate SNR as the anticorrelated ROIs in the actual data (for the instance shown here, r = 0.35±0.03 (mean±SD across subjects)). For the time-averaged coherence, error bars indicate the standard error of the mean over 50 iterations.
Figure 9
Figure 9
(A) Variability (standard deviation) over the sequence of 2-min sliding-window correlation coefficients, averaged across all 12 subjects. Five ROIs chosen for further analysis are labeled. (B) t-maps of positive and negative correlations with the PCC (red and blue, respectively, and thresholded identically to Fig. 1), superimposed for anatomical comparison with regions of high variability (SD>0.18; magenta). (C) The intersection of group-level seeded correlation maps (computed across all time points in the scan) using ROIs 1, 2, and 3 as seed regions (green overlay), and using ROIs 4 and 5 as seed regions (cyan overlay). The slice location (z, mm) appears in white numerals and also applies to parts (A) and (B).
Figure 10
Figure 10
Range of sliding-window correlation values for ROIs 1–5 (Fig. 9A), for window sizes of 2 min (top row) and 4 min (bottom row). Vertical lines indicate the minimum and maximum values of the windowed correlation coefficient across the scan, and the dot on each bar indicates the mean.
Figure 11
Figure 11
Group average (N=12) of Fisher z-transformed correlation coefficients between 5 ROIs (Fig. 9A) whose correlation with the PCC was highly variable over time. High mutual correlation was observed between ROIs 1–3, and between ROIs 4–5.
Figure 12
Figure 12
(Top row) Time-averaged coherence for for the 5 ROIs indicated in Fig. 9A. Thick lines represent the mean across subjects (N=12), and error bars represent standard error. (Bottom row) Histograms of the number of subjects for which the variance in the WTC between the PCC and the indicated ROI exceeded the 90% (blue) and 95% (red) confidence levels, for each wavelet scale (Fourier period).
Figure 13
Figure 13
Raw time series and sliding-window correlation coefficients between the PCC and (A) ROI5 and (B) ROI2, shown for one subject (Subject 1). Sliding-window correlation coefficients are plotted at the time point corresponding to the center of its associated window.
Figure 14
Figure 14
Negative correlations with the PCC across two successive 7-min segments of resting-state data, shown for one subject. (A) First 7 min, (B) second 7 min. Intensity values represent correlation coefficient (color scale is 0.08

References

    1. Achard S, Salvador R, Whitcher B, Suckling J, Bullmore E. A resilient, low-frequency, small-world human brain functional network with highly connected association cortical hubs. J Neurosci. 2006;26:63–72. - PMC - PubMed
    1. Almeida M, Botelho LF, da Silva AM, Brett M, Poline JB, Anton J-L, Andrade A. Time-frequency analysis of brain connectivity with fMRI: A new method based on Wavelet Transform Coherence. Organization for Human Brain Mapping, 12th Annual Meeting; Chicago. 2007. Poster 250 M-PM.
    1. Barnes A, Bullmore ET, Suckling J. Endogenous human brain dynamics recover slowly following cognitive effort. PLoS One. 2009;4:e6626. - PMC - PubMed
    1. Beason-Held LL, Kraut MA, Resnick SM. Stability Of Default-Mode Network Activity In The Aging Brain. Brain Imaging Behav. 2009;3:123–131. - PMC - PubMed
    1. Beckmann CF, DeLuca M, Devlin JT, Smith SM. Investigations into resting-state connectivity using independent component analysis. Philos Trans R Soc Lond B Biol Sci. 2005;360:1001–1013. - PMC - PubMed

Publication types