. 2009 Dec 16;97(12):3075-85.
doi: 10.1016/j.bpj.2009.09.034.

Combining laser microsurgery and finite element modeling to assess cell-level epithelial mechanics

Affiliations

Combining laser microsurgery and finite element modeling to assess cell-level epithelial mechanics

M Shane Hutson et al. Biophys J. .

Abstract

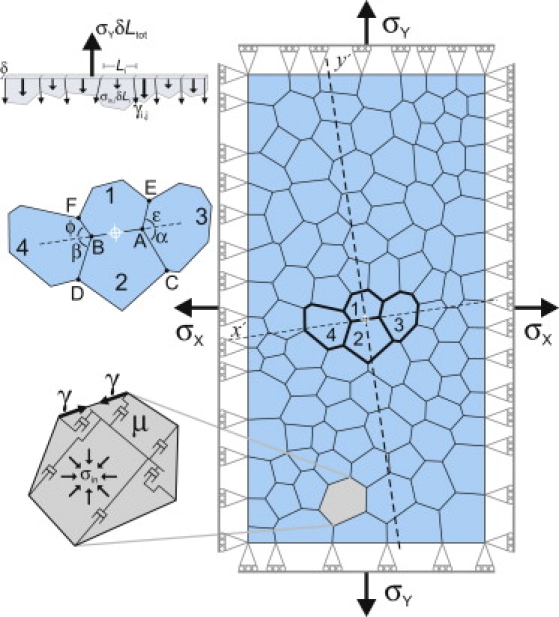
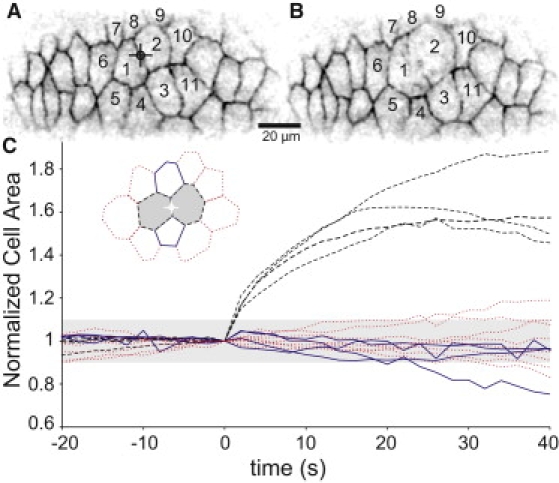
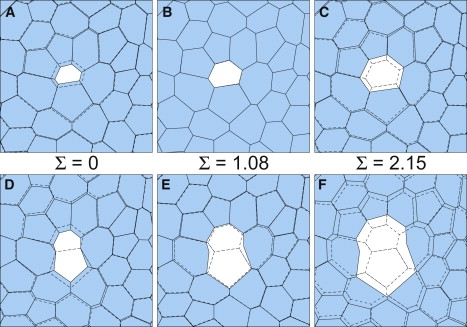
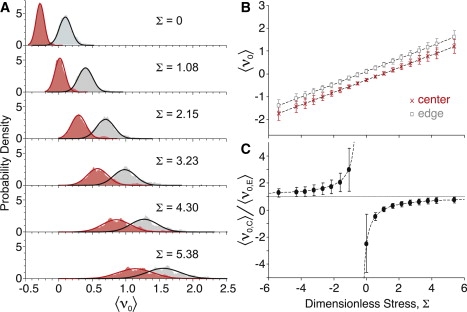
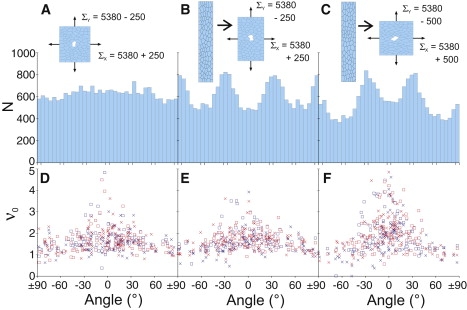
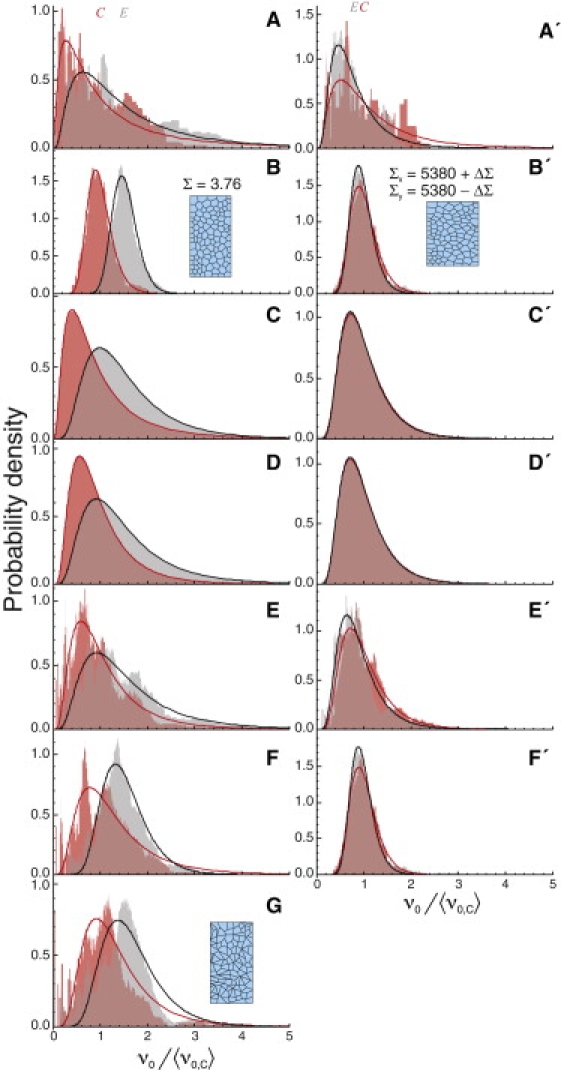
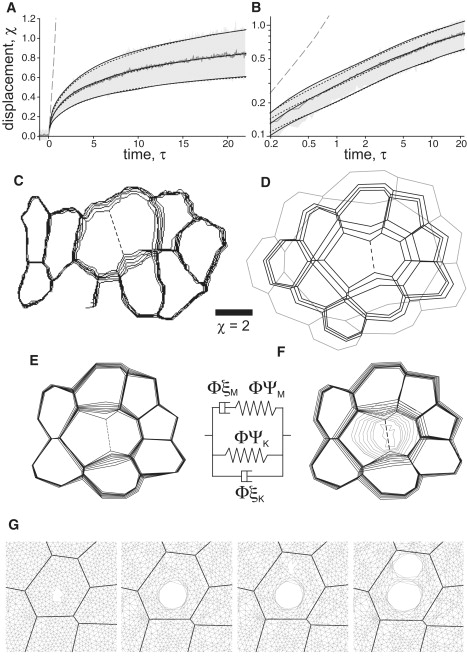
Laser microsurgery and finite element modeling are used to determine the cell-level mechanics of the amnioserosa-a morphogenetically crucial epithelium on the dorsal surface of fruit fly embryos (Drosophila melanogaster). In the experiments, a tightly focused laser ablates a subcellular hole (1 microm in diameter) that passes clean through the epithelium. The surrounding cells recoil from the wound site with a large range of initial recoil velocities. These depend on the embryo's developmental stage and the subcellular wound site. The initial recoil (up to 0.1 s) is well reproduced by a base finite element model, which assumes a uniform effective viscosity inside the cells, a constant tension along each cell-cell boundary, and a large, potentially anisotropic, far-field stress--one that far exceeds the stress equivalent of the cell-edge tensions. After 0.1 s, the experimental recoils slow dramatically. This observation can be reproduced by adding viscoelastic rods along cell edges or as a fine prestressed mesh parallel to the apical and basal membranes of the cell. The mesh also reproduces a number of double-wounding experiments in which successive holes are drilled in a single cell.


Figures

Figure 1
Figure 1
Cell-level finite-element representation of an epithelium: (upper inset) force balance along one edge of a cell patch; (middle) the local wound geometry; and (lower) the model for each cell.
Figure 2
Figure 2
Experimental results for laser hole-drilling. (A and B) Confocal fluorescent images (inverted) of an embryonic epithelium before and 30 s after ablation at the targeted crosshairs. (C) Changes in the normalized apical surface area of nearby cells. In the graphical legend, the border of each cell type matches its line in the plot: (dashed) cells directly sharing the ablated border (e.g., cells 1 and 2); (solid) nearest neighboring cells (e.g., cells 3 and 8); and (dotted) next-nearest neighbors (e.g., cells 4–7 and 9–11). The plot compiles results from four experiments. The lightly-shaded region marks area changes of ±10%.
Figure 3
Figure 3
Changes in cell shape just after ablation—simulation results for cell-center wounds (AC) and cell-edge wounds (DF). The cell shapes before ablation (dashed) are superimposed on those just after ablation (τ = 1.12). The ablated cell(s) are unshaded. The isotropic external stress Σ increases from left to right.
Figure 4
Figure 4
Dependence of recoil velocity on external stress Σ. (A) Kernel density estimates of the ν0-distributions (N = 100 for each): (dark red) cell-center wounds; (light gray) cell-edge wounds; (solid lines) best-fit normal distributions. (B) Mean recoil velocity: (□) cell-edge and (×) cell-center wounds. (C) Ratio of the mean recoil velocities.
Figure 5
Figure 5
Anisotropy in the recoil velocity ν0 under anisotropic external stress Σ. (B and C) Cell patch was first stretched vertically as shown. (AC) Histograms of cell-edge orientations. (DF) ν0 versus direction for cell-edge (□) and cell-center (×) wounds. For cell-edge wounds, the tracked direction was always parallel to the ablated edge. Similar results for γ < 0 are presented in Fig S2.
Figure 6
Figure 6
Comparison of ν0-distributions for experiments and simulations: (dark red) cell-center wounds; (light gray) cell-edge wounds; (solid lines) best-fit log-normal distributions. 〈ν0,C〉 and 〈ν0,E〉 are marked by the red C and gray E, respectively. Unprimed labels refer to early dorsal closure, primed to late: (A and A′) experimental recoil velocities; (B and B′) best-matching uniform simulations; (C and C′) addition of interembryo log-normal variations in Σ; (D and D′) addition of interembryo log-normal variations in all force/viscosity ratios; (E and E′) addition of intraembryo log-normal variations in viscosity; (F and F′) nonequilibrium simulations with intraembryo log-normal variations in the interfacial tensions γ; and (G) simulations with intraembryo log-normal variations in γ that were reequilibrated before wounding. The sample patches show the cell geometry after equilibration at the noted stress Σ, including the misshapen cells after reequilibration with variable γ in panel G. For late dorsal closure, similar results with γ < 0 are presented in Fig S3.
Figure 7
Figure 7
Reproducing the postablation recoil kinetics using viscoelastic elements. (A) Dimensionless displacement versus time, after cell-edge wounds: (jagged gray line, shaded region) experimental mean ± one SD in early dorsal closure; (long-dashed line) simulated recoil with no viscoelastic elements; (short-dashed lines) simulated recoils using viscoelastic rods along cell edges; or (solid lines) as a prestressed intracellular mesh. Σ = 3.76 in each. (B) Log-log version of same. (CF) Time-dependent cell outlines around expanding wound sites: (C) experimental cell-edge wound; (D) simulation with no viscoelastic elements; (E) simulation with viscoelastic rods along cell edges; and (F) as a prestressed intracellular mesh. The lighter shaded lines outline the expanding hole in the mesh. Both panels E and F correspond to the best fits to the mean experimental recoil in panel A. The sequential outlines include τ = 0 and a geometric sequence of times from τ = 2.5–40 for the experiment (i.e., 1–16 s) and τ = 0.28–17.85 for the simulations, except panel D, which stops at τ = 1.12. The dimensionless scale bar applies to all four sets of outlines. Animated versions are available as Movie S1, Movie S2, and Movie S3. (G) Simulated recoil in a cell subjected to two successive wounds. The second panel represents the equilibrium state reached after the first ablation; the fourth panel is the new equilibrium state after the second ablation. In terms of area, the second expansion is ∼35% as large as the first. The standard viscoelastic rod element is shown between panels E and F and the parameters of each simulation are listed in Table S1.

References

    1. Odell G.M., Oster G., Alberch P., Burnside B. The mechanical basis of morphogenesis. 1. Epith. Fold. Invag. Dev. Biol. 1981;85:446–462. - PubMed
    1. Clausi D.A., Brodland G.W. Mechanical evaluation of theories of neurulation using computer-simulations. Development. 1993;118:1013–1023.
    1. Davidson L.A., Koehl M.A.R., Keller R., Oster G.F. How sea-urchins invaginate—using biomechanics to distinguish between mechanisms of primary invagination. Development. 1995;121:2005–2018. - PubMed
    1. Chen H.H., Brodland G.W. Cell-level finite element studies of viscous cells in planar aggregates. J. Biomech. Eng. 2000;122:394–401. - PubMed
    1. Zajac M., Jones G.L., Glazier J.A. Model of convergent extension in animal morphogenesis. Phys. Rev. Lett. 2000;85:2022–2025. - PubMed

Publication types

LinkOut - more resources