. 2009 Dec 16;97(12):3086-94.
doi: 10.1016/j.bpj.2009.08.060.

A novel method to quantify contribution of channels and transporters to membrane potential dynamics

Affiliations

A novel method to quantify contribution of channels and transporters to membrane potential dynamics

Chae Young Cha et al. Biophys J. .

Abstract

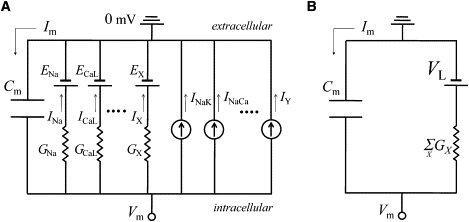
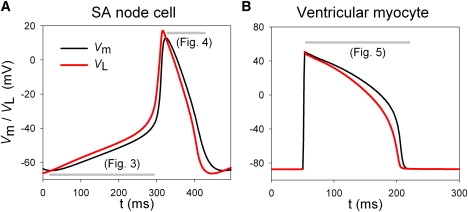
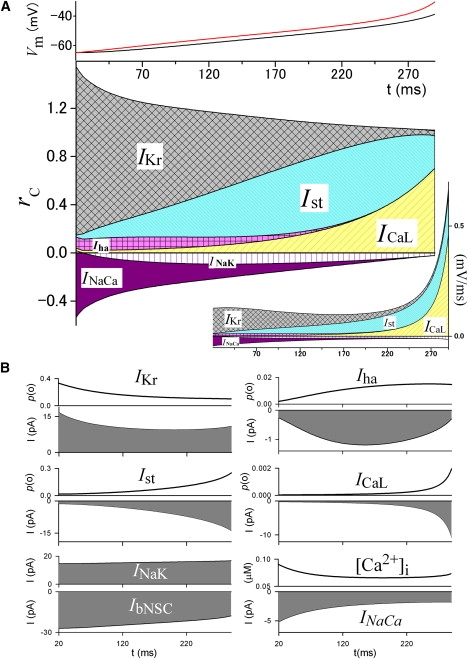
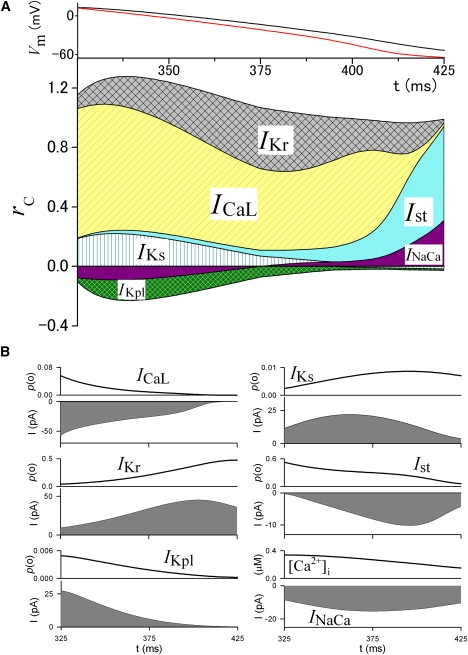
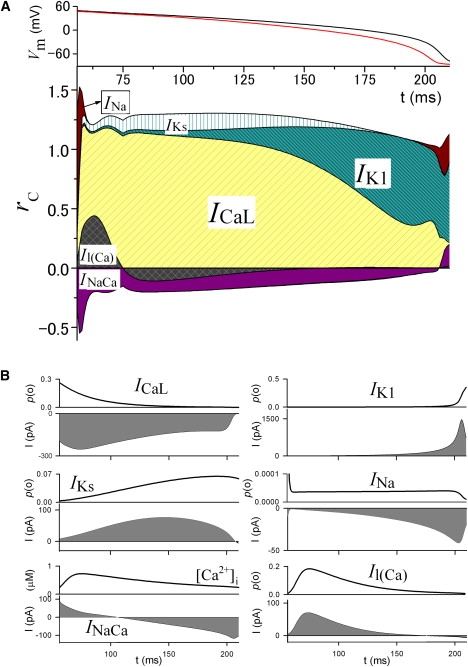
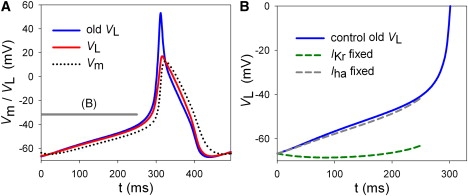
The action potential, once triggered in ventricular or atrial myocytes, automatically proceeds on its time course or is generated spontaneously in sinoatrial node pacemaker cells. It is induced by complex interactions among such cellular components as ion channels, transporters, intracellular ion concentrations, and signaling molecules. We have developed what is, to our knowledge, a new method using a mathematical model to quantify the contribution of each cellular component to the automatic time courses of the action potential. In this method, an equilibrium value, which the membrane potential is approaching at a given moment, is calculated along the time course of the membrane potential. The calculation itself is based on the time-varying conductance and the reversal potentials of individual ion channels and electrogenic ion transporters. Since the equilibrium potential moves in advance of the membrane potential change, we refer to it as the lead potential, V(L). The contribution of an individual current was successfully quantified by comparing dV(L)/dt before and after fixing the time-dependent change of a component of interest, such as the variations in the open probability of a channel or the turnover rate of an ion transporter. In addition to the action potential, the lead-potential analysis should also be applicable in all types of membrane excitation in many different kinds of cells.


Figures

Figure 1
Figure 1
Equivalent electrical circuit of the cell membrane. (A) An equivalent circuit for the membrane electrical behavior expressed by Eq. 5. Cm, membrane capacitance; EX, reversal potential for a channel X; IY, current through transporter Y; Im, total membrane current. (B) A reduced circuit equivalent to Eq. 7.
Figure 2
Figure 2
Time-dependent changes of VL (red) and Vm (black) in the SA node cell model (A) and ventricular myocyte model (B). The period for current injection was excluded from calculation of VL in panel B (50–52 ms). The gray bars indicate the time spans analyzed in Figs. 3–5.
Figure 3
Figure 3
Time profile of rc during slow diastolic depolarization in the SA node model. (A) (Top) Time-dependent changes of VL (red) and Vm (black). These are the same curves as those shown in Fig. 2A. (Bottom) Time-dependent changes of rc of the major current components calculated by Eq. 12. (Inset, right bottom) The numerators in Eq. 12 for the corresponding currents. (B) Changes of p(o) or amplitude of the corresponding currents, and [Ca2+]i. It should be noted that the numerical calculation of rc has poor precision when dVL/dt approaches 0 because rc is normalized with dVL/dt (the denominator in Eq. 12). Therefore, we excluded the ranges in which dVL/dt is close to zero from the analyses (also done in Figs. 4 and 5).
Figure 4
Figure 4
Time profile of rc during repolarization of the SA node action potential. (A) (Top) Time-dependent changes of VL (red) and Vm (black). These are the same curves as those shown in Fig. 2A. (Bottom) Time-dependent changes of rc of the major membrane currents. (B) Changes of p(o) or amplitude of the corresponding currents, and [Ca2+]i.
Figure 5
Figure 5
The time profile of rc during repolarization of the ventricular action potential. (A) (Top) Time-dependent changes of VL (red) and Vm (black). These are the same curves as those shown in Fig. 2B. (Bottom) Time-dependent changes of rc of the major membrane currents. (B) Changes of p(o) or amplitude of the corresponding currents, and [Ca2+]i.
Figure 6
Figure 6
Comparison of VL determined by Eq. 8 (red solid) with the old VL determined by Eq. 17 (blue solid). (A) Both VL values meet with Vm (black dotted) at dVm/dt = 0. The curves for the present VL and Vm are the same as those shown in Fig. 2. The gray bars indicate the time spans analyzed in panel B. (B) Modified time courses of VL after fixing of IKr (green dashed) or Iha (gray dashed). The VL (blue) curve is the same as the blue curve in panel A.

Similar articles

Cited by

References

    1. Cannon S.C., Brown R.H., Corey D.P. Theoretical reconstruction of myotonia and paralysis caused by incomplete inactivation of sodium channels. Biophys. J. 1993;65:270–288. - PMC - PubMed
    1. Chay T.R., Lee Y.S. Studies on re-entrant arrhythmias and ectopic beats in excitable tissues by bifurcation analyses. J. Theor. Biol. 1992;155:137–171. - PubMed
    1. Kurata Y., Hisatome I., Imanishi S., Shibamoto T. Roles of L-type Ca2+ and delayed-rectifier K+ currents in sinoatrial node pacemaking: insights from stability and bifurcation analyses of a mathematical model. Am. J. Physiol. Heart Circ. Physiol. 2003;285:H2804–H2819. - PubMed
    1. Kurata Y., Hisatome I., Matsuda H., Shibamoto T. Dynamical mechanisms of pacemaker generation in IK1-downregulated human ventricular myocytes: insights from bifurcation analyses of a mathematical model. Biophys. J. 2005;89:2865–2887. - PMC - PubMed
    1. Kim T.H., Shin S.Y., Choo S.M., Cho K.H. Dynamical analysis of the calcium signaling pathway in cardiac myocytes based on logarithmic sensitivity analysis. Biotechnol. J. 2008;3:639–647. - PubMed

Publication types