

Variable Field Proton-Electron Double-Resonance Imaging: Application to pH mapping of aqueous samples
- PMID: 20007019
- PMCID: PMC2818733
- DOI: 10.1016/j.jmr.2009.11.017
Variable Field Proton-Electron Double-Resonance Imaging: Application to pH mapping of aqueous samples
Abstract
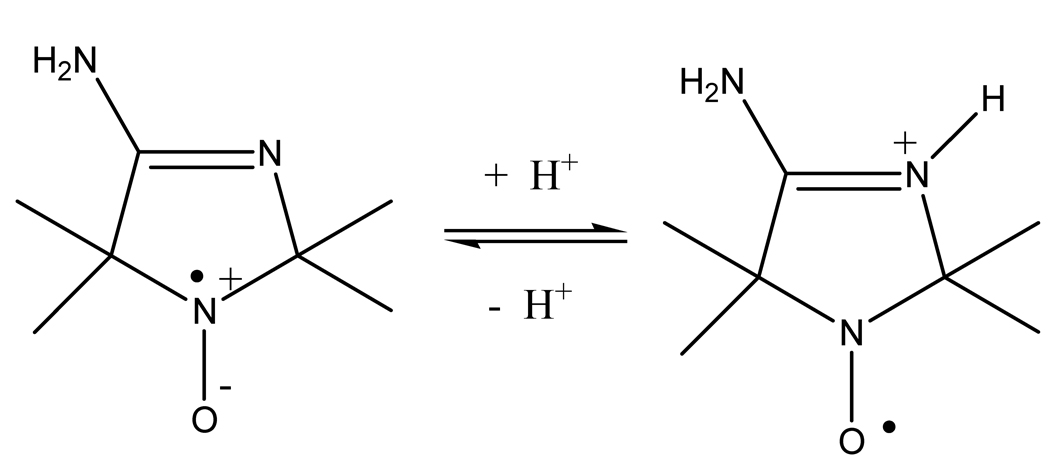
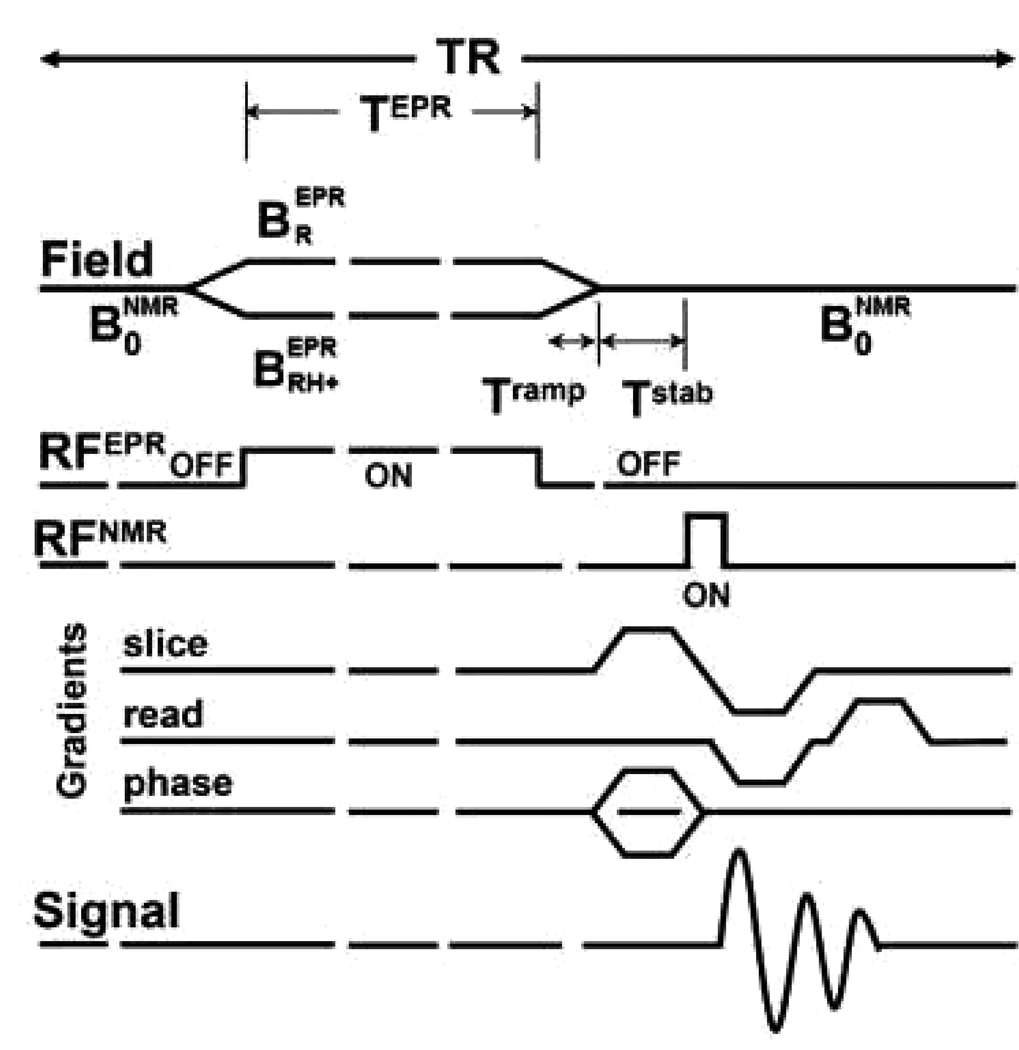
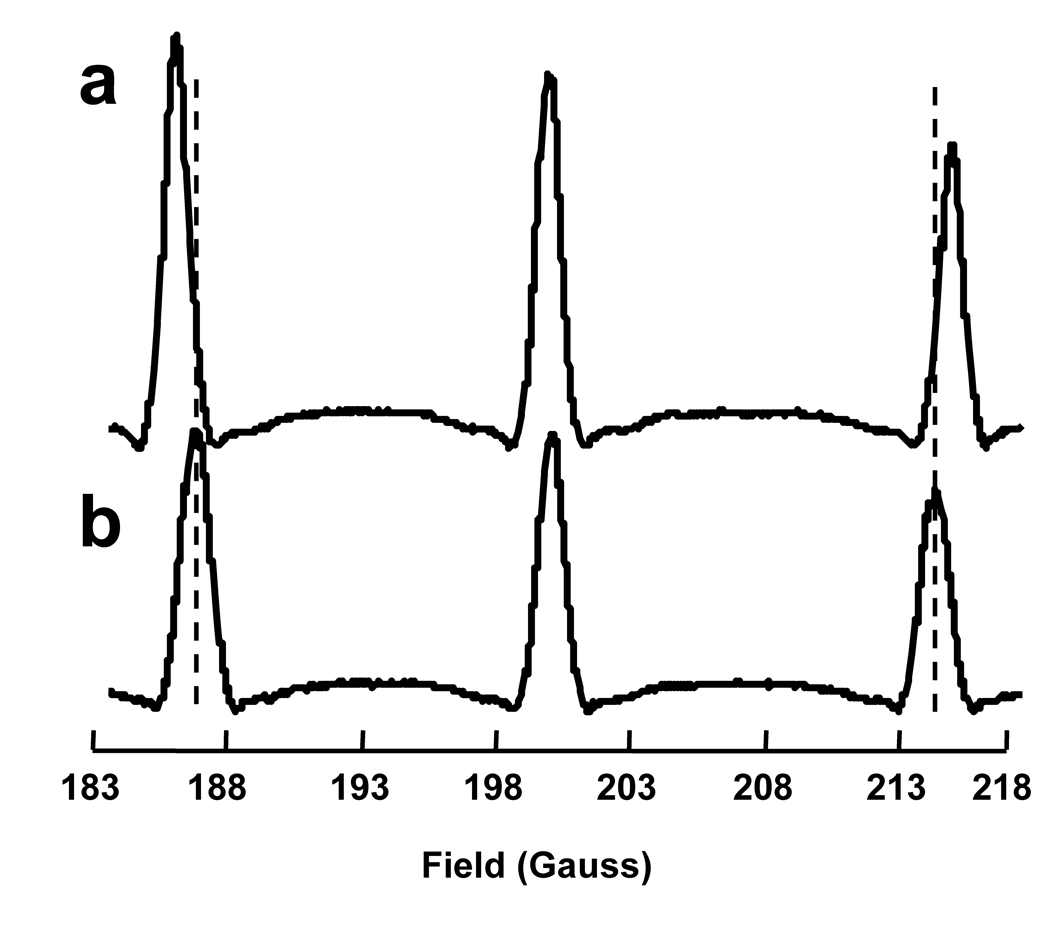
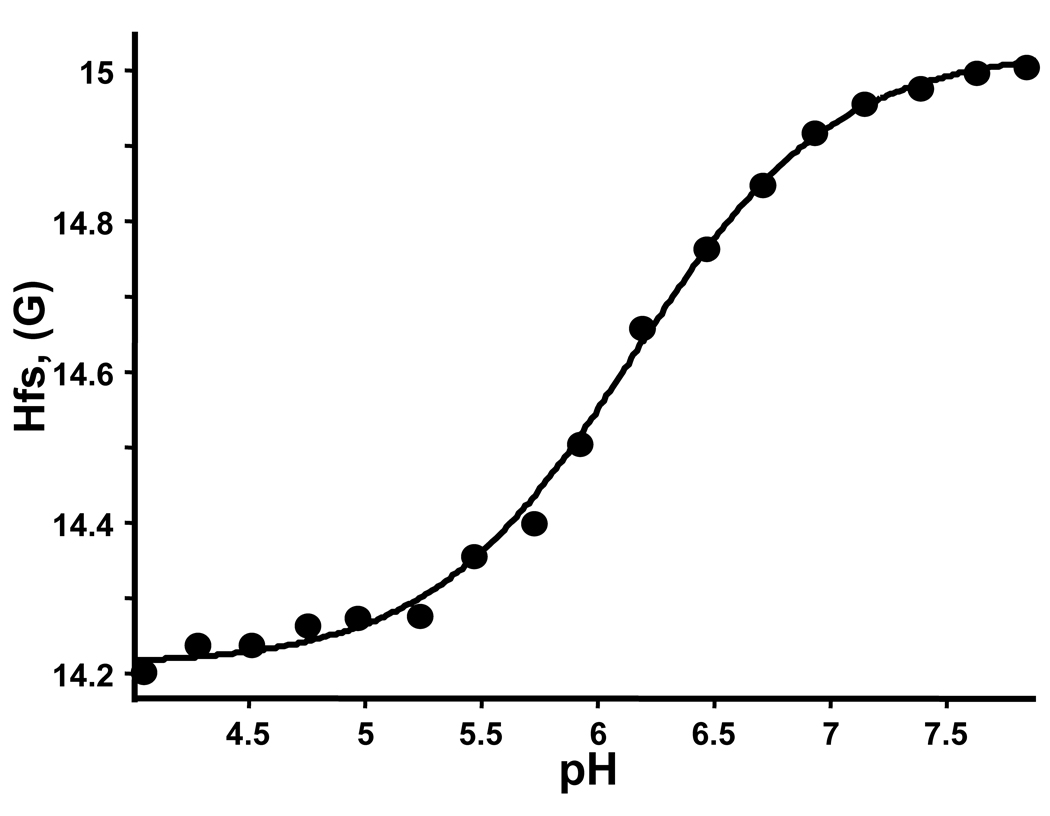
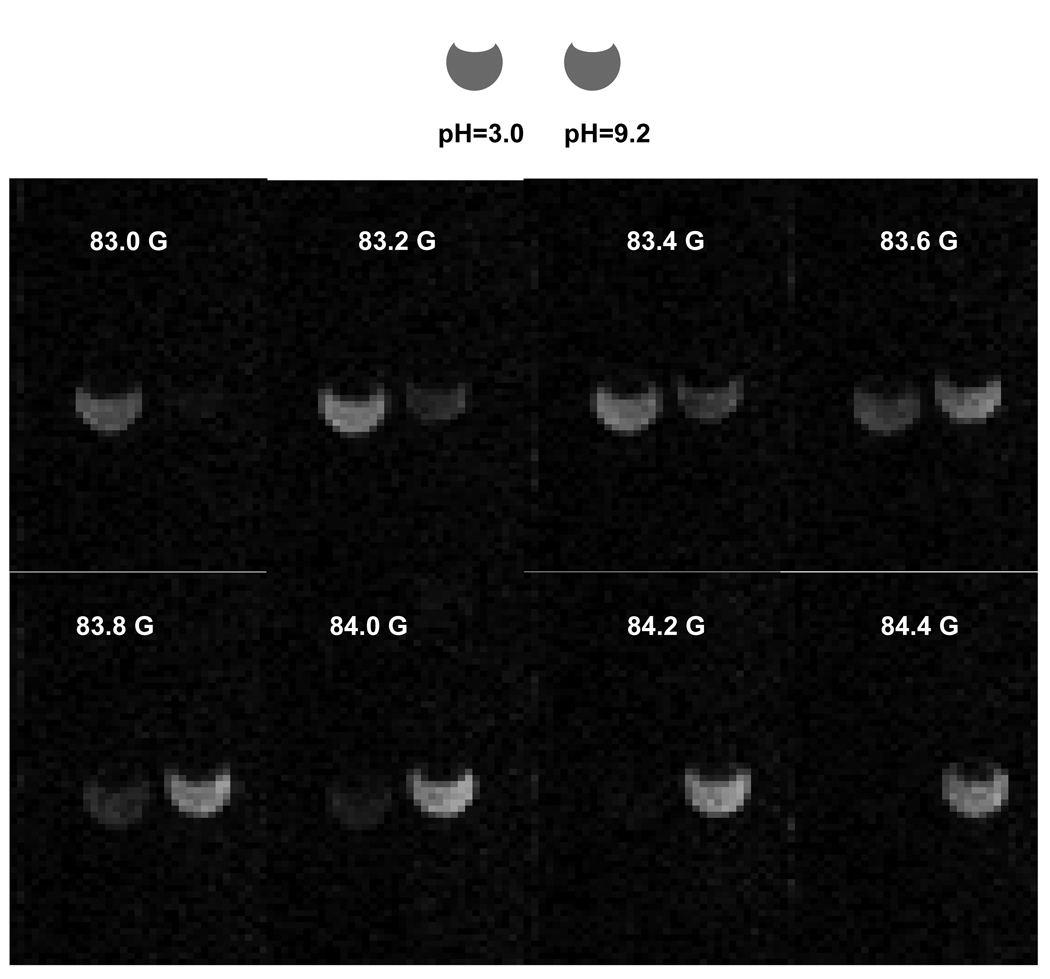
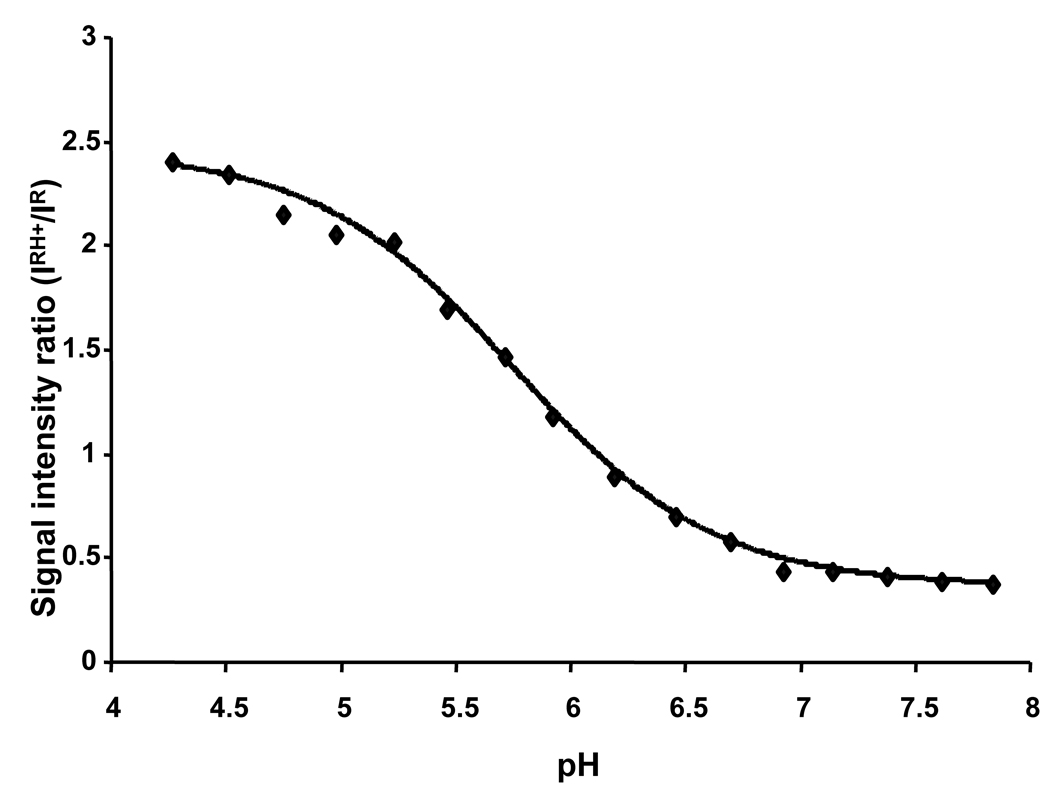
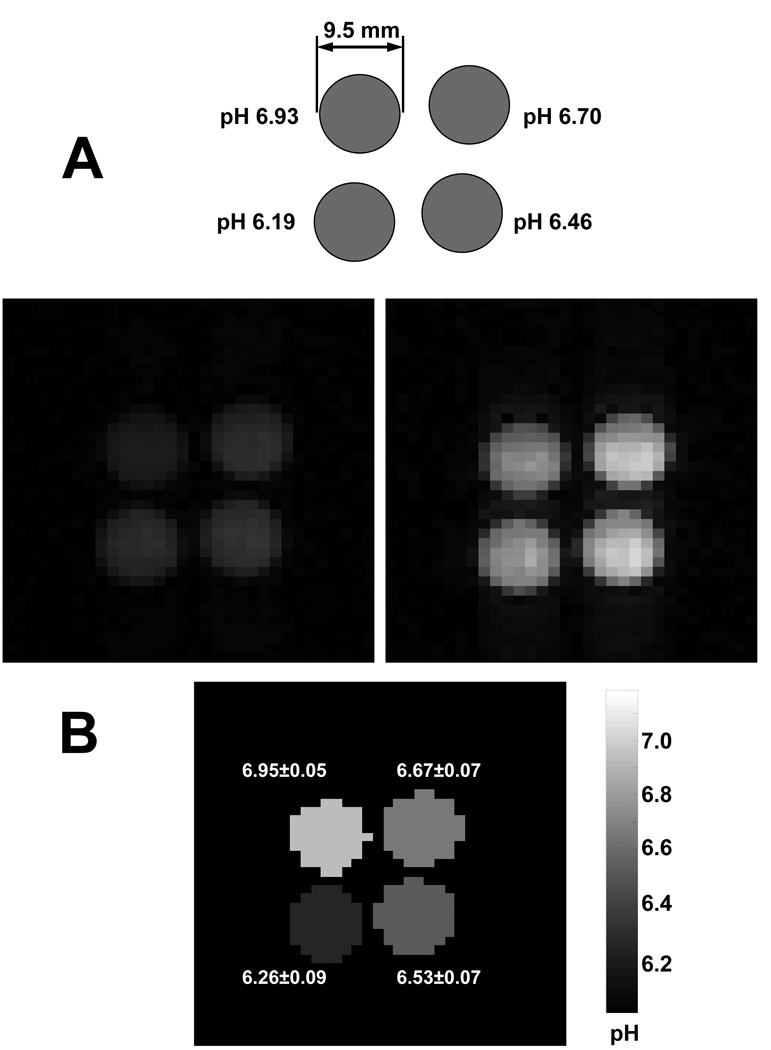
A new concept of Variable Field Proton-Electron Double-Resonance Imaging (VF PEDRI) is proposed. This allows for functional mapping using specifically designed paramagnetic probes (e.g. oxygen or pH mapping) with MRI high quality spatial resolution and short acquisition time. Studies performed at 200 G field MRI with phantoms show that a pH map of the sample can be extracted using only two PEDRI images acquired in 140 s at pre-selected EPR excitation fields providing pH resolution of 0.1 pH units and a spatial resolution of 1.25mm. Note that while concept of functional VF PEDRI was demonstrated using the pH probe, it can be applied for studies of other biologically relevant parameters of the medium such as redox state, concentrations of oxygen or glutathione using specifically designed EPR probes.
Published by Elsevier Inc.
Figures
Similar articles
-
In vivo proton-electron double-resonance imaging of extracellular tumor pH using an advanced nitroxide probe.Anal Chem. 2014 Jan 21;86(2):1045-52. doi: 10.1021/ac402230h. Epub 2014 Jan 6. Anal Chem. 2014. PMID: 24372284 Free PMC article.
-
Variable radio frequency proton-electron double-resonance imaging: application to pH mapping of aqueous samples.J Magn Reson. 2011 Apr;209(2):227-32. doi: 10.1016/j.jmr.2011.01.011. Epub 2011 Jan 15. J Magn Reson. 2011. PMID: 21320790 Free PMC article.
-
15N-Labeled 4-oxo-2,2,6,6-tetramethyl-piperidine-1-oxyl.2008 Apr 30 [updated 2008 Jun 9]. In: Molecular Imaging and Contrast Agent Database (MICAD) [Internet]. Bethesda (MD): National Center for Biotechnology Information (US); 2004–2013. 2008 Apr 30 [updated 2008 Jun 9]. In: Molecular Imaging and Contrast Agent Database (MICAD) [Internet]. Bethesda (MD): National Center for Biotechnology Information (US); 2004–2013. PMID: 20641553 Free Books & Documents. Review.
-
3-Carboxy-2,2,5,5-tetramethyl-pyrrolidinyl-N-oxyl.2008 Apr 30 [updated 2008 Jun 9]. In: Molecular Imaging and Contrast Agent Database (MICAD) [Internet]. Bethesda (MD): National Center for Biotechnology Information (US); 2004–2013. 2008 Apr 30 [updated 2008 Jun 9]. In: Molecular Imaging and Contrast Agent Database (MICAD) [Internet]. Bethesda (MD): National Center for Biotechnology Information (US); 2004–2013. PMID: 20641530 Free Books & Documents. Review.
-
3-Carbamoyl-2,2,5,5-tetramethyl-1-pyrrolidinyl-N-oxyl.2008 Apr 30 [updated 2008 Jun 9]. In: Molecular Imaging and Contrast Agent Database (MICAD) [Internet]. Bethesda (MD): National Center for Biotechnology Information (US); 2004–2013. 2008 Apr 30 [updated 2008 Jun 9]. In: Molecular Imaging and Contrast Agent Database (MICAD) [Internet]. Bethesda (MD): National Center for Biotechnology Information (US); 2004–2013. PMID: 20641525 Free Books & Documents. Review.
Cited by
-
Standard-based method for proton-electron double resonance imaging of oxygen.J Magn Reson. 2011 Sep;212(1):197-203. doi: 10.1016/j.jmr.2011.06.030. Epub 2011 Jul 2. J Magn Reson. 2011. PMID: 21807539 Free PMC article.
-
In vivo monitoring of pH, redox status, and glutathione using L-band EPR for assessment of therapeutic effectiveness in solid tumors.Magn Reson Med. 2012 Jun;67(6):1827-36. doi: 10.1002/mrm.23196. Epub 2011 Nov 23. Magn Reson Med. 2012. PMID: 22113626 Free PMC article.
-
Exchange Phenomena in the Electron Paramagnetic Resonance Spectra of the Nitroxyl and Trityl Radicals: Multifunctional Spectroscopy and Imaging of Local Chemical Microenvironment.Anal Chem. 2017 May 2;89(9):4758-4771. doi: 10.1021/acs.analchem.6b03796. Epub 2017 Apr 10. Anal Chem. 2017. PMID: 28363027 Free PMC article. Review.
-
Electron paramagnetic resonance monitoring of ischemia-induced myocardial oxygen depletion and acidosis in isolated rat hearts using soluble paramagnetic probes.Magn Reson Med. 2012 Aug;68(2):649-55. doi: 10.1002/mrm.23251. Epub 2011 Dec 12. Magn Reson Med. 2012. PMID: 22162021 Free PMC article.
-
In vivo proton-electron double-resonance imaging of extracellular tumor pH using an advanced nitroxide probe.Anal Chem. 2014 Jan 21;86(2):1045-52. doi: 10.1021/ac402230h. Epub 2014 Jan 6. Anal Chem. 2014. PMID: 24372284 Free PMC article.
References
-
- Eaton GR, Eaton SE, Ohno K, editors. EPR imaging and in vivo EPR. Boca Raton: CRC Press; 1991.
-
- Kuppusamy P, Zweier JL. Cardiac applications of EPR imaging. NMR Biomed. 2004;17:226–239. - PubMed
-
- Matsumoto K, Subramanian S, Murugesan R, Mitchell JB, Krishna MC. Spatially resolved biologic information from in vivo EPRI, OMRI, and MRI. Antioxidants & Redox Signaling. 2007;9:1125–1141. - PubMed
Publication types
MeSH terms
Substances
Grants and funding
LinkOut - more resources
Full Text Sources
Other Literature Sources
Medical
