

Autophagy induction reduces mutant ataxin-3 levels and toxicity in a mouse model of spinocerebellar ataxia type 3
- PMID: 20007218
- PMCID: PMC2801325
- DOI: 10.1093/brain/awp292
Autophagy induction reduces mutant ataxin-3 levels and toxicity in a mouse model of spinocerebellar ataxia type 3
Abstract
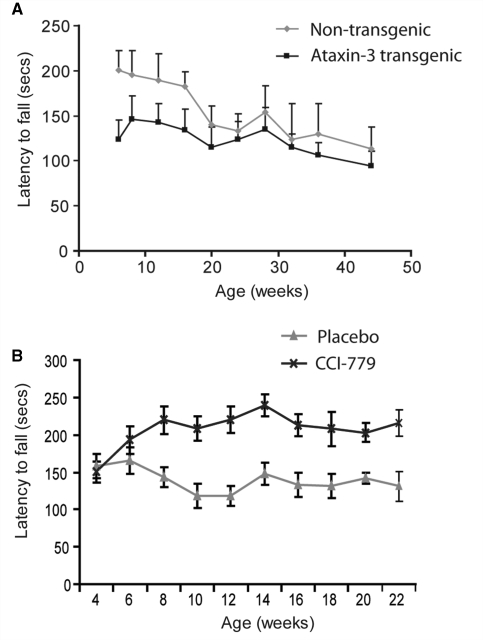
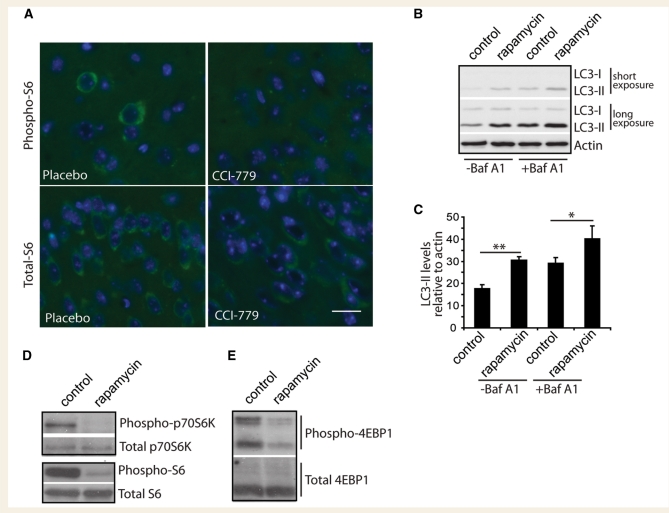
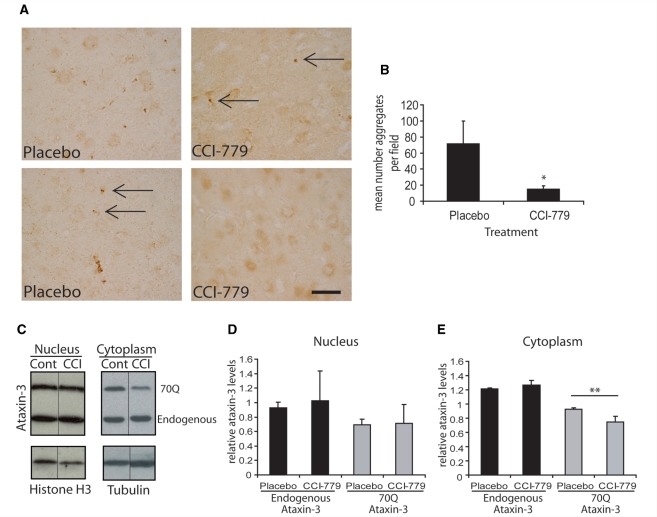
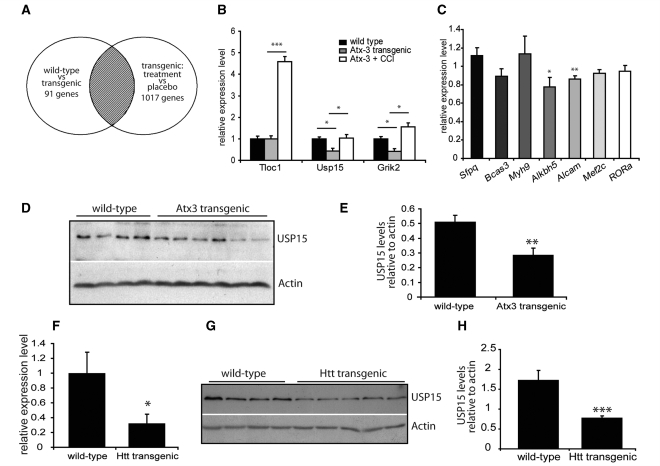
Spinocerebellar ataxia type 3 is a neurodegenerative disorder caused by the expansion of the polyglutamine repeat region within the ataxin-3 protein. The mutant protein forms intracellular aggregates in the brain. However, the cellular mechanisms causing toxicity are still poorly understood and there are currently no effective treatments. In this study we show that administration of a rapamycin ester (cell cycle inhibitor-779, temsirolimus) improves motor performance in a transgenic mouse model of spinocerebellar ataxia type 3. Temsirolimus inhibits mammalian target of rapamycin and hence upregulates protein degradation by autophagy. Temsirolimus reduces the number of aggregates seen in the brains of transgenic mice and decreases levels of cytosolic soluble mutant ataxin-3, while endogenous wild-type protein levels remain unaffected. Temsirolimus is designed for long-term use in patients and therefore represents a possible therapeutic strategy for the treatment of spinocerebellar ataxia type 3. Using this disease model and treatment paradigm, we employed a microarray approach to investigate transcriptional changes that might be important in the pathogenesis of spinocerebellar ataxia type 3. This identified ubiquitin specific peptidase-15, which showed expression changes at both the messenger ribonucleic acid and protein level. Ubiquitin specific peptidase-15 levels were also changed in mice expressing another mutant polyglutamine protein, huntingtin. In total we identified 16 transcripts that were decreased in transgenic ataxin-3 mice that were normalized following temsirolimus treatment. In this mouse model with relatively mild disease progression, the number of transcripts changed was low and the magnitude of these changes was small. However, the importance of these transcriptional alterations in the pathogenesis of spinocerebellar ataxia type 3 remains unclear.
Figures
Similar articles
-
Ataxin-3 protein modification as a treatment strategy for spinocerebellar ataxia type 3: removal of the CAG containing exon.Neurobiol Dis. 2013 Oct;58:49-56. doi: 10.1016/j.nbd.2013.04.019. Epub 2013 May 6. Neurobiol Dis. 2013. PMID: 23659897
-
Cerebellar soluble mutant ataxin-3 level decreases during disease progression in Spinocerebellar Ataxia Type 3 mice.PLoS One. 2013 Apr 23;8(4):e62043. doi: 10.1371/journal.pone.0062043. Print 2013. PLoS One. 2013. PMID: 23626768 Free PMC article.
-
Overexpression of the autophagic beclin-1 protein clears mutant ataxin-3 and alleviates Machado-Joseph disease.Brain. 2011 May;134(Pt 5):1400-15. doi: 10.1093/brain/awr047. Epub 2011 Apr 7. Brain. 2011. PMID: 21478185
-
Mutant Ataxin-3-Containing Aggregates (MATAGGs) in Spinocerebellar Ataxia Type 3: Dynamics of the Disorder.Mol Neurobiol. 2021 Jul;58(7):3095-3118. doi: 10.1007/s12035-021-02314-z. Epub 2021 Feb 24. Mol Neurobiol. 2021. PMID: 33629274 Review.
-
Progress in pathogenesis studies of spinocerebellar ataxia type 1.Philos Trans R Soc Lond B Biol Sci. 1999 Jun 29;354(1386):1079-81. doi: 10.1098/rstb.1999.0462. Philos Trans R Soc Lond B Biol Sci. 1999. PMID: 10434309 Free PMC article. Review.
Cited by
-
Macroautophagy abnormality in essential tremor.PLoS One. 2012;7(12):e53040. doi: 10.1371/journal.pone.0053040. Epub 2012 Dec 27. PLoS One. 2012. PMID: 23300858 Free PMC article.
-
Propeptide of aminopeptidase 1 protein mediates aggregation and vesicle formation in cytoplasm-to-vacuole targeting pathway.J Biol Chem. 2012 Mar 23;287(13):10121-10133. doi: 10.1074/jbc.M111.311696. Epub 2011 Nov 28. J Biol Chem. 2012. PMID: 22123825 Free PMC article.
-
Lithium chloride alleviates neurodegeneration partly by inhibiting activity of GSK3β in a SCA3 Drosophila model.Cerebellum. 2013 Dec;12(6):892-901. doi: 10.1007/s12311-013-0498-3. Cerebellum. 2013. PMID: 23812869
-
Autophagy mediates SUMO-induced degradation of a polyglutamine protein ataxin-3.Anim Cells Syst (Seoul). 2017 May 25;21(3):169-176. doi: 10.1080/19768354.2017.1330765. eCollection 2017. Anim Cells Syst (Seoul). 2017. PMID: 30460066 Free PMC article.
-
Lithium chloride therapy fails to improve motor function in a transgenic mouse model of Machado-Joseph disease.Cerebellum. 2014 Dec;13(6):713-27. doi: 10.1007/s12311-014-0589-9. Cerebellum. 2014. PMID: 25112410
References
-
- Albrecht M, Golatta M, Wullner U, Lengauer T. Structural and functional analysis of ataxin-2 and ataxin-3. Eur J Biochem. 2004;271:3155–70. - PubMed
-
- Berger Z, Ravikumar B, Menzies FM, Oroz LG, Underwood BR, Pangalos MN, et al. Rapamycin alleviates toxicity of different aggregate-prone proteins. Hum Mol Genet. 2006;15:433–42. - PubMed
-
- Burnett B, Li F, Pittman RN. The polyglutamine neurodegenerative protein ataxin-3 binds polyubiquitylated proteins and has ubiquitin protease activity. Hum Mol Genet. 2003;12:3195–205. - PubMed
Publication types
MeSH terms
Substances
Grants and funding
LinkOut - more resources
Full Text Sources
Other Literature Sources
Molecular Biology Databases
