Proteome bioprofiles distinguish between M1 priming and activation states in human macrophages
- PMID: 20007246
- PMCID: PMC2858305
- DOI: 10.1189/jlb.0809570
Proteome bioprofiles distinguish between M1 priming and activation states in human macrophages
Abstract
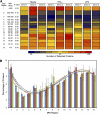
Macrophage activation is a dynamic process that results in diverse functional outcomes ranging from immunoregulation to inflammation. The proinflammatory, or M1, response is a complex, bimodal progression composed of a "prime," classically through IFN-gamma, and "trigger," such as LPS. To characterize the physiological response of M1 activation, a systems biology approach was applied to determine the intracellular proteome bioprofiles of IFN-gamma-and LPS-treated primary human macrophages. Our goal was to develop intracellular proteomic fingerprints to serve as novel correlates of macrophage priming and/or activation to augment the existing approaches of analyzing secreted cytokines and cell-surface protein expression. The majority of the proteome, approximately 78%, remained stable during activation, representing the core proteome. In contrast, three distinct patterns defined response proteomes: IFN-gamma-specific, LPS-specific, or IFN-gamma- and LPS-shared or M1-specific. Although steady-state expression levels of proteins involved in energy metabolism and immune response were increased during priming and triggering, changes in protein and fatty acid metabolism, signaling, and transport pathways were most apparent. Unique proteomic fingerprints distinguish among IFN-gamma-specific, LPS-specific, or M1-specific activation states and provide a clear molecular, archeological profile to infer recent history of cells, as well as correlates for chronic macrophage activation in health and disease.
Figures


Similar articles
-
Contribution of FP receptors in M1 macrophage polarization via IL-10-regulated nuclear translocation of NF-κB p65.Biochim Biophys Acta Mol Cell Biol Lipids. 2020 May;1865(5):158654. doi: 10.1016/j.bbalip.2020.158654. Epub 2020 Feb 6. Biochim Biophys Acta Mol Cell Biol Lipids. 2020. PMID: 32036038
-
Transforming growth factor beta 1 and gamma interferon provide opposing signals to lipopolysaccharide-activated mouse macrophages.Infect Immun. 1994 Sep;62(9):3625-32. doi: 10.1128/iai.62.9.3625-3632.1994. Infect Immun. 1994. PMID: 8063378 Free PMC article.
-
IFN-gamma and IFN-beta independently stimulate the expression of lipopolysaccharide-inducible genes in murine peritoneal macrophages.J Immunol. 1989 Apr 1;142(7):2325-31. J Immunol. 1989. PMID: 2494257
-
Sequential expression of macrophage anti-microbial/inflammatory and wound healing markers following innate, alternative and classical activation.Clin Exp Immunol. 2010 Jun;160(3):369-79. doi: 10.1111/j.1365-2249.2009.04086.x. Epub 2010 Jan 5. Clin Exp Immunol. 2010. PMID: 20059482 Free PMC article.
-
Macrophage Polarization: Different Gene Signatures in M1(LPS+) vs. Classically and M2(LPS-) vs. Alternatively Activated Macrophages.Front Immunol. 2019 May 24;10:1084. doi: 10.3389/fimmu.2019.01084. eCollection 2019. Front Immunol. 2019. PMID: 31178859 Free PMC article. Review.
Cited by
-
Unveiling the Physical and Functional Niches of FAM26F by Analyzing Its Subcellular Localization and Novel Interacting Partners.ACS Omega. 2020 Aug 25;5(35):22008-22020. doi: 10.1021/acsomega.0c01249. eCollection 2020 Sep 8. ACS Omega. 2020. PMID: 32923759 Free PMC article.
-
NRG4-ErbB4 signaling represses proinflammatory macrophage activity.Am J Physiol Gastrointest Liver Physiol. 2021 Jun 1;320(6):G990-G1001. doi: 10.1152/ajpgi.00296.2020. Epub 2021 Apr 7. Am J Physiol Gastrointest Liver Physiol. 2021. PMID: 33826403 Free PMC article.
-
Deep neural network modeling identifies biomarkers of response to immune-checkpoint therapy.iScience. 2022 Apr 9;25(5):104228. doi: 10.1016/j.isci.2022.104228. eCollection 2022 May 20. iScience. 2022. PMID: 35494249 Free PMC article.
-
Pre-infection transcript levels of FAM26F in peripheral blood mononuclear cells inform about overall plasma viral load in acute and post-acute phase after simian immunodeficiency virus infection.J Gen Virol. 2016 Dec;97(12):3400-3412. doi: 10.1099/jgv.0.000632. Epub 2016 Oct 18. J Gen Virol. 2016. PMID: 27902344 Free PMC article.
-
Immuno-modulatory Effect of IFN-gamma in AMD and its Role as a Possible Target for Therapy.J Clin Exp Ophthalmol. 2013 Feb 26;Suppl 2:0071-76. doi: 10.4172/2155-9570-S2-007. J Clin Exp Ophthalmol. 2013. PMID: 24977104 Free PMC article.
References
-
- Agarwal S, Piesco N P, Johns L P, Riccelli A E. Differential expression of IL-1 β, TNF-α, IL-6, and IL-8 in human monocytes in response to lipopolysaccharides from different microbes. J Dent Res. 1995;74:1057–1065. - PubMed
-
- Yoshimura T, Matsushima K, Oppenheim J J, Leonard E J. Neutrophil chemotactic factor produced by lipopolysaccharide (LPS)-stimulated human blood mononuclear leukocytes: partial characterization and separation from interleukin 1 (IL 1) J Immunol. 1987;139:788–793. - PubMed
-
- Taffet S M, Singhel K J, Overholtzer J F, Shurtleff S A. Regulation of tumor necrosis factor expression in a macrophage-like cell line by lipopolysaccharide and cyclic AMP. Cell Immunol. 1989;120:291–300. - PubMed

