

A GMCSF-neuroantigen fusion protein is a potent tolerogen in experimental autoimmune encephalomyelitis (EAE) that is associated with efficient targeting of neuroantigen to APC
- PMID: 20007248
- PMCID: PMC2830126
- DOI: 10.1189/jlb.0709520
A GMCSF-neuroantigen fusion protein is a potent tolerogen in experimental autoimmune encephalomyelitis (EAE) that is associated with efficient targeting of neuroantigen to APC
Abstract
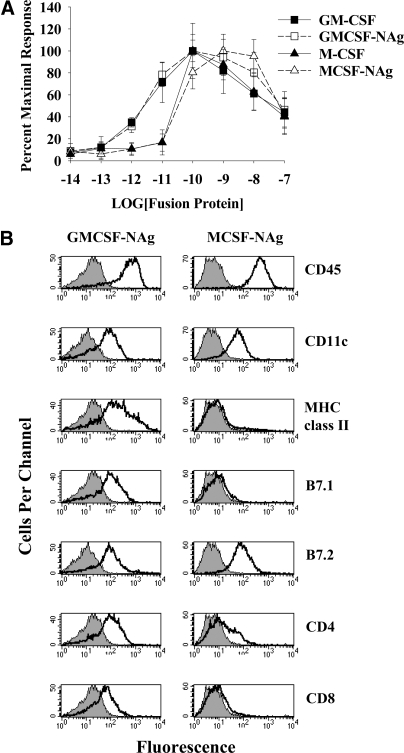
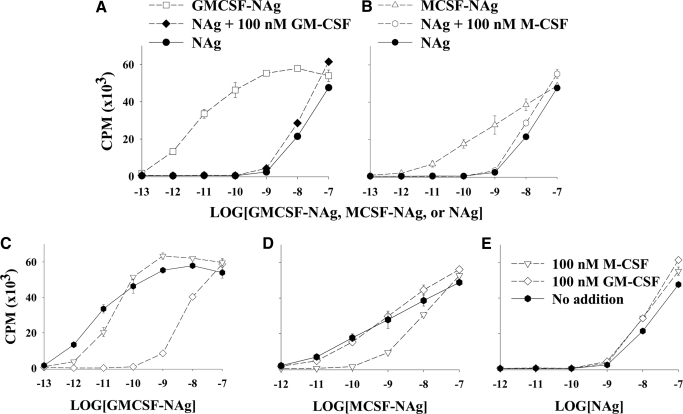
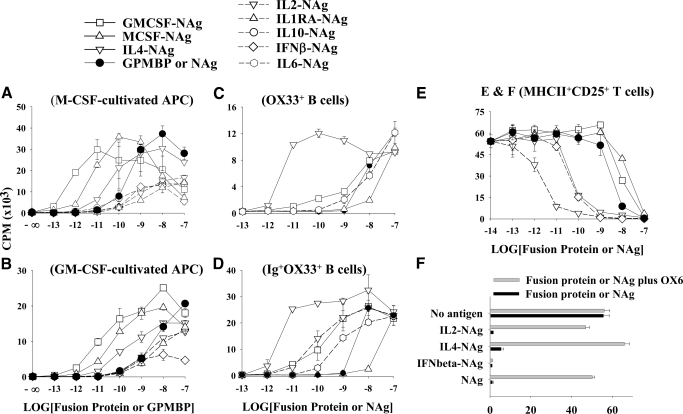
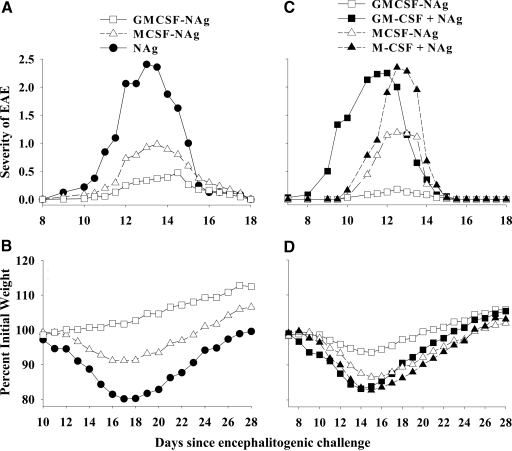
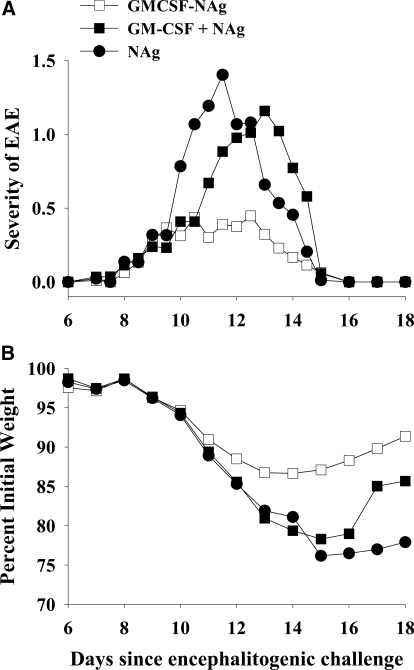
Cytokine-NAg fusion proteins represent an emerging platform for specific targeting of self-antigen to particular APC subsets as a means to achieve antigen-specific immunological tolerance. This study focused on cytokine-NAg fusion proteins that targeted NAg to myeloid APC. Fusion proteins contained GM-CSF or the soluble extracellular domain of M-CSF as the N-terminal domain and the encephalitogenic 69-87 peptide of MBP as the C-terminal domain. GMCSF-NAg and MCSF-NAg fusion proteins were approximately 1000-fold and 32-fold more potent than NAg in stimulating antigenic proliferation of MBP-specific T cells, respectively. The potentiated antigenic responses required cytokine-NAg covalent linkage and receptor-mediated uptake. That is, the respective cytokines did not potentiate antigenic responses when cytokine and NAg were added as separate molecules, and the potentiated responses were inhibited specifically by the respective free cytokine. Cytokine-dependent targeting of NAg was specific for particular subsets of APC. GMCSF-NAg and MCSF-NAg targeted NAg to DC and macrophages; conversely, IL4-NAg and IL2-NAg fusion proteins, respectively, induced an 1000-fold enhancement in NAg reactivity in the presence of B cell and T cell APC. GMCSF-NAg significantly attenuated severity of EAE when treatment was completed before encephalitogenic challenge or alternatively, when treatment was initiated after onset of EAE. MCSF-NAg also had significant tolerogenic activity, but GMCSF-NAg was substantially more efficacious as a tolerogen. Covalent GMCSF-NAg linkage was required for prevention and treatment of EAE. In conclusion, GMCSF-NAg was highly effective for targeting NAg to myeloid APC and was a potent, antigen-specific tolerogen in EAE.
Figures
Similar articles
-
A GMCSF-Neuroantigen Tolerogenic Vaccine Elicits Systemic Lymphocytosis of CD4+ CD25high FOXP3+ Regulatory T Cells in Myelin-Specific TCR Transgenic Mice Contingent Upon Low-Efficiency T Cell Antigen Receptor Recognition.Front Immunol. 2019 Jan 10;9:3119. doi: 10.3389/fimmu.2018.03119. eCollection 2018. Front Immunol. 2019. PMID: 30687323 Free PMC article.
-
IL-2/neuroantigen fusion proteins as antigen-specific tolerogens in experimental autoimmune encephalomyelitis (EAE): correlation of T cell-mediated antigen presentation and tolerance induction.J Immunol. 2007 Mar 1;178(5):2835-43. doi: 10.4049/jimmunol.178.5.2835. J Immunol. 2007. PMID: 17312127
-
GM-CSF-neuroantigen fusion proteins reverse experimental autoimmune encephalomyelitis and mediate tolerogenic activity in adjuvant-primed environments: association with inflammation-dependent, inhibitory antigen presentation.J Immunol. 2014 Sep 1;193(5):2317-29. doi: 10.4049/jimmunol.1303223. Epub 2014 Jul 21. J Immunol. 2014. PMID: 25049359 Free PMC article.
-
Monoclonal antibody-induced inhibition of relapsing EAE in SJL/J mice correlates with inhibition of neuroantigen-specific cell-mediated immune responses.J Neuroimmunol. 1987 Nov;16(3):345-64. doi: 10.1016/0165-5728(87)90110-x. J Neuroimmunol. 1987. PMID: 2444626 Review.
-
Antigen-specific tolerance as a therapy for experimental autoimmune encephalomyelitis.Int Rev Immunol. 1992;9(3):203-22. doi: 10.3109/08830189209061791. Int Rev Immunol. 1992. PMID: 1285061 Review.
Cited by
-
Antigen-Specific Treatment Modalities in MS: The Past, the Present, and the Future.Front Immunol. 2021 Feb 19;12:624685. doi: 10.3389/fimmu.2021.624685. eCollection 2021. Front Immunol. 2021. PMID: 33679769 Free PMC article. Review.
-
A GMCSF-Neuroantigen Tolerogenic Vaccine Elicits Systemic Lymphocytosis of CD4+ CD25high FOXP3+ Regulatory T Cells in Myelin-Specific TCR Transgenic Mice Contingent Upon Low-Efficiency T Cell Antigen Receptor Recognition.Front Immunol. 2019 Jan 10;9:3119. doi: 10.3389/fimmu.2018.03119. eCollection 2018. Front Immunol. 2019. PMID: 30687323 Free PMC article.
-
Depletion of CD4+ CD25+ regulatory T cells confers susceptibility to experimental autoimmune encephalomyelitis (EAE) in GM-CSF-deficient Csf2-/- mice.J Leukoc Biol. 2016 Oct;100(4):747-760. doi: 10.1189/jlb.3A0815-359R. Epub 2016 Jun 2. J Leukoc Biol. 2016. PMID: 27256565 Free PMC article.
-
Emerging Therapeutics for Immune Tolerance: Tolerogenic Vaccines, T cell Therapy, and IL-2 Therapy.Front Immunol. 2021 Mar 29;12:657768. doi: 10.3389/fimmu.2021.657768. eCollection 2021. Front Immunol. 2021. PMID: 33854514 Free PMC article. Review.
-
Design and molecular dynamic simulation of a new double-epitope tolerogenic protein as a potential vaccine for multiple sclerosis disease.Res Pharm Sci. 2019 Feb;14(1):20-26. doi: 10.4103/1735-5362.251849. Res Pharm Sci. 2019. PMID: 30936929 Free PMC article.
References
-
- Goodin D S, Cohen B A, O'Connor P, Kappos L, Stevens J C. Assessment: the use of natalizumab (Tysabri) for the treatment of multiple sclerosis (an evidence-based review): report of the Therapeutics and Technology Assessment Subcommittee of the American Academy of Neurology. Neurology. 2008;71:766–773. - PubMed
-
- Kleinschnitz C, Meuth S G, Wiendl P H. The trials and errors in MS therapy. Int MS J. 2008;15:79–90. - PubMed
-
- Linker R A, Kieseier B C, Gold R. Identification and development of new therapeutics for multiple sclerosis. Trends Pharmacol Sci. 2008;29:558–565. - PubMed
-
- Lutterotti A, Sospedra M, Martin R. Antigen-specific therapies in MS—current concepts and novel approaches. J Neurol Sci. 2008;274:18–22. - PubMed
-
- Miller S D, Turley D M, Podojil J R. Antigen-specific tolerance strategies for the prevention and treatment of autoimmune disease. Nat Rev Immunol. 2007;7:665–677. - PubMed
Publication types
MeSH terms
Substances
LinkOut - more resources
Full Text Sources
Other Literature Sources
Molecular Biology Databases
Research Materials
Miscellaneous
