. 2010 Mar;38(3):431-40.
doi: 10.1124/dmd.109.028712. Epub 2009 Dec 9.

Glucuronidation of dihydrotestosterone and trans-androsterone by recombinant UDP-glucuronosyltransferase (UGT) 1A4: evidence for multiple UGT1A4 aglycone binding sites

Affiliations

Glucuronidation of dihydrotestosterone and trans-androsterone by recombinant UDP-glucuronosyltransferase (UGT) 1A4: evidence for multiple UGT1A4 aglycone binding sites

Jin Zhou et al. Drug Metab Dispos. 2010 Mar.

Abstract

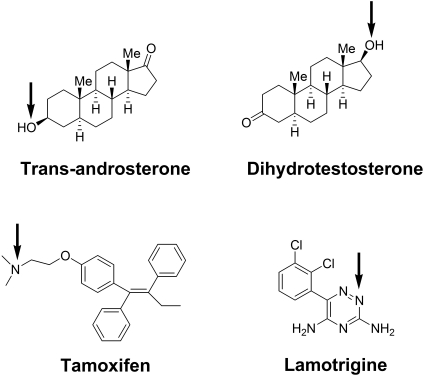
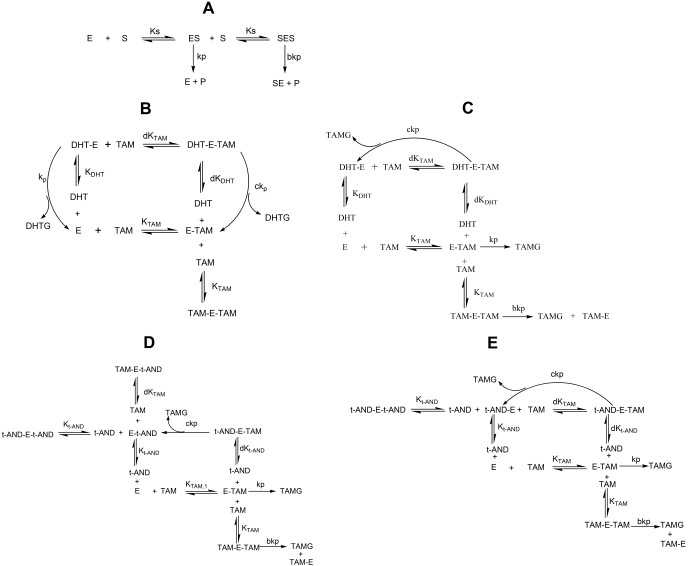
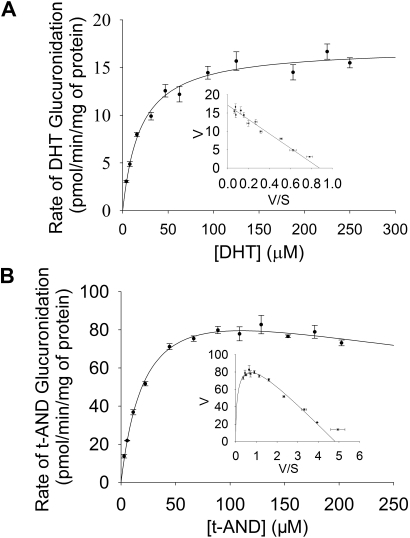
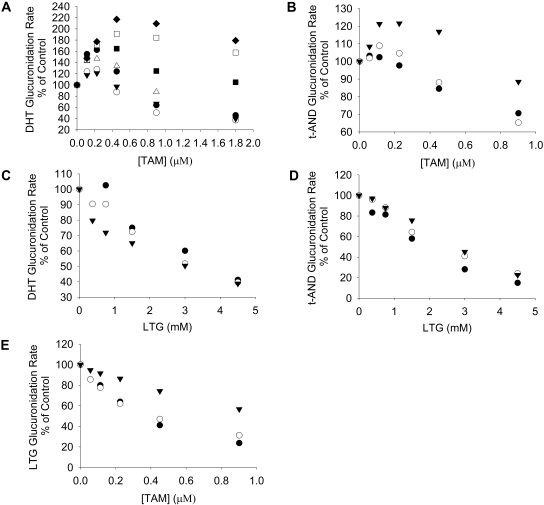
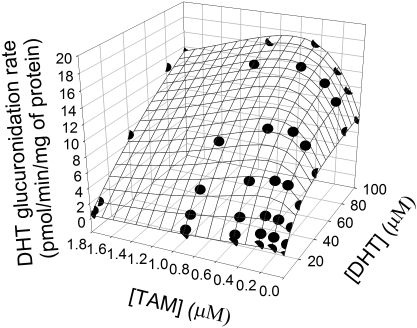
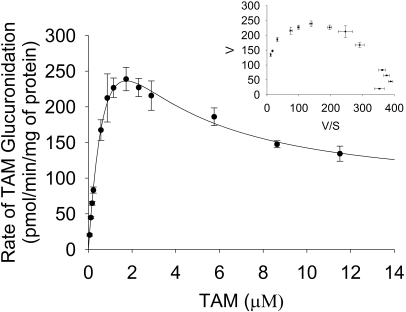
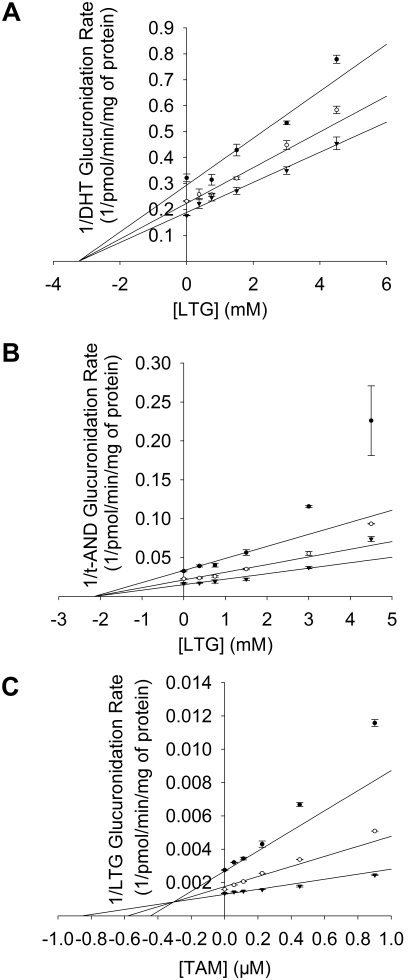
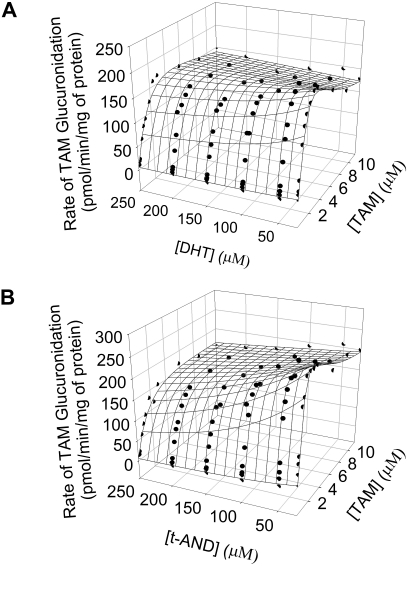
UDP-glucuronosyltransferase (UGT) 1A4-catalyzed glucuronidation is an important drug elimination pathway. Although atypical kinetic profiles (nonhyperbolic, non-Michaelis-Menten) of UGT1A4-catalyzed glucuronidation have been reported occasionally, systematic kinetic studies to explore the existence of multiple aglycone binding sites in UGT1A4 have not been conducted. To this end, two positional isomers, dihydrotestosterone (DHT) and trans-androsterone (t-AND), were used as probe substrates, and their glucuronidation kinetics with HEK293-expressed UGT1A4 were evaluated both alone and in the presence of a UGT1A4 substrate [tamoxifen (TAM) or lamotrigine (LTG)]. Coincubation with TAM, a high-affinity UGT1A4 substrate, resulted in a concentration-dependent activation/inhibition effect on DHT and t-AND glucuronidation, whereas LTG, a low-affinity UGT1A4 substrate, noncompetitively inhibited both processes. The glucuronidation kinetics of TAM were then evaluated both alone and in the presence of different concentrations of DHT or t-AND. TAM displayed substrate inhibition kinetics, suggesting that TAM may have two binding sites in UGT1A4. However, the substrate inhibition kinetic profile of TAM became more hyperbolic as the DHT or t-AND concentration was increased. Various two-site kinetic models adequately explained the interactions between TAM and DHT or TAM and t-AND. In addition, the effect of TAM on LTG glucuronidation was evaluated. In contrast to the mixed effect of TAM on DHT and t-AND glucuronidation, TAM inhibited LTG glucuronidation. Our results suggest that multiple aglycone binding sites exist within UGT1A4, which may result in atypical kinetics (both homotropic and heterotropic) in a substrate-dependent fashion.


Figures

Fig. 1.
Fig. 1.
Structures of DHT, t-AND, TAM, and LTG. The glucuronidation sites of the compounds are illustrated with arrows.
Fig. 2.
Fig. 2.
Two-site kinetic models. A, a kinetic model for substrate inhibition kinetics (eq. 7). B, a kinetic model to explain the effect of TAM on DHT glucuronidation (eq. 8). C, a kinetic model to explain the effect of DHT on TAM glucuronidation (eq. 9). D and E, kinetic models to explain the effect of t-AND on TAM glucuronidation (eqs. 10 and 11). kp is the effective catalytic constant. Ks, KDHT, Kt-AND, and KTAM are binding affinity constants. Constant b and c reflect change in kp and constant d reflects changes in binding affinity. DHTG, DHT glucuronidation; TAMG, TAM glucuronidation.
Fig. 3.
Fig. 3.
Kinetic plots (rate versus [S]) for DHT (A) and t-AND (B) glucuronidation by recombinant UGT1A4. The bars indicate the range of triplicate measurements. The embedded figures are Eadie-Hofstee plots for the same data. The Michaelis-Menten equation (eq. 2) was fit to the data for DHT glucuronidation. The uncompetitive substrate inhibition equation (eq. 3) was fit to the data for t-AND glucuronidation.
Fig. 4.
Fig. 4.
Rate percentage of control versus [S] plots: for the effect of TAM on DHT glucuronidation (A); for the effect of TAM on t-AND glucuronidation (B); for the effect of LTG on DHT glucuronidation (C); for the effect of LTG on t-AND glucuronidation (D); and for the effect of TAM on LTG glucuronidation (E). Data points are means of duplicate measurements. Coefficients of variation are all within 10%. Symbols in A represent DHT concentrations: 2.5 (●), 5 (○), 10 (▾), 20 (▵), 40 (■), 80 (□), and 100 (♦) μM. Symbols in B, C, and D represent DHT and t-AND concentrations: 10 (●), 20 (○), and 40 (▾) μM. Symbols in E represent LTG concentrations: 0.75 (●), 1.5 (○), and 3.0 (▾) mM. TAM concentration in the plots was corrected for nonspecific protein binding. Controls refer to incubations in which the concentration of the modifier was zero.
Fig. 5.
Fig. 5.
Kinetic modeling for the effect of TAM on DHT glucuronidation. The surface plot was predicted with eq. 8 (Fig. 2B), and the TAM concentration in the plot was corrected for nonspecific protein binding.
Fig. 6.
Fig. 6.
Kinetic plots (rate versus [S]) for TAM glucuronidation by recombinant UGT1A4. The bars indicate the range of triplicate measurements. The inset shows Eadie-Hofstee plots for the same data. A two-site model (Fig. 2A; eq. 7) was fit to the data.
Fig. 7.
Fig. 7.
Dixon plots for inhibition of DHT glucuronidation by LTG (A), for inhibition of t-AND glucuronidation by LTG (B), and for inhibition of LTG glucuronidation by TAM (C). The bars indicate the range of duplicate measurements. A one-site noncompetitive inhibition model (eq. 5) was fit to the data in A and B. Symbols represent DHT and t-AND concentrations: 10 (●), 20 (○), and 40 (▾) μM. A one-site competitive inhibition model (eq. 4) was fit to the data in C. Symbols represent LTG concentrations: 0.75 (●), 1.5 (○), and 3.0 (▾) mM. The TAM concentration in C was corrected for nonspecific protein binding.
Fig. 8.
Fig. 8.
Kinetic modeling for effect of DHT (A) and t-AND (B) on TAM glucuronidation. The surface plot in A is a predicted result with eq. 9 (Fig. 2C), and the surface plot in B is a predicted result with eq. 11 (Fig. 2E). The TAM concentration was corrected for nonspecific protein binding.

Similar articles

Cited by

References

    1. Chouinard S, Tessier M, Vernouillet G, Gauthier S, Labrie F, Barbier O, Bélanger A. (2006) Inactivation of the pure antiestrogen fulvestrant and other synthetic estrogen molecules by UDP-glucuronosyltransferase 1A enzymes expressed in breast tissue. Mol Pharmacol 69:908–920 - PubMed
    1. Collom SL, Laddusaw RM, Burch AM, Kuzmic P, Perry MD, Jr, Miller GP. (2008) CYP2E1 substrate inhibition. Mechanistic interpretation through an effector site for monocyclic compounds. J Biol Chem 283:3487–3496 - PMC - PubMed
    1. Fisher MB, Campanale K, Ackermann BL, VandenBranden M, Wrighton SA. (2000) In vitro glucuronidation using human liver microsomes and the pore-forming peptide alamethicin. Drug Metab Dispos 28:560–566 - PubMed
    1. Fujiwara R, Nakajima M, Yamanaka H, Katoh M, Yokoi T. (2008) Product inhibition of UDP-glucuronosyltransferase (UGT) enzymes by UDP obfuscates the inhibitory effects of UGT substrates. Drug Metab Dispos 36:361–367 - PubMed
    1. Galetin A, Clarke SE, Houston JB. (2002) Quinidine and haloperidol as modifiers of CYP3A4 activity: multisite kinetic model approach. Drug Metab Dispos 30:1512–1522 - PubMed

Publication types

MeSH terms

LinkOut - more resources