

A large intrinsically disordered region in SKIP and its disorder-order transition induced by PPIL1 binding revealed by NMR
- PMID: 20007319
- PMCID: PMC2836099
- DOI: 10.1074/jbc.M109.087528
A large intrinsically disordered region in SKIP and its disorder-order transition induced by PPIL1 binding revealed by NMR
Abstract
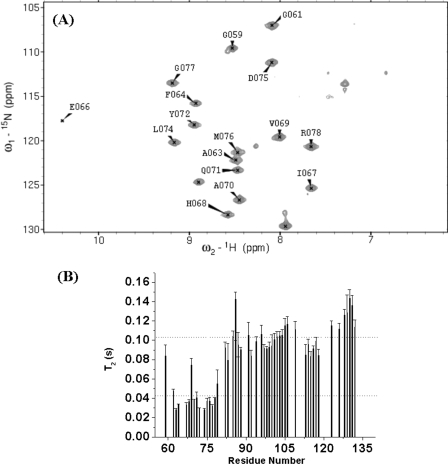
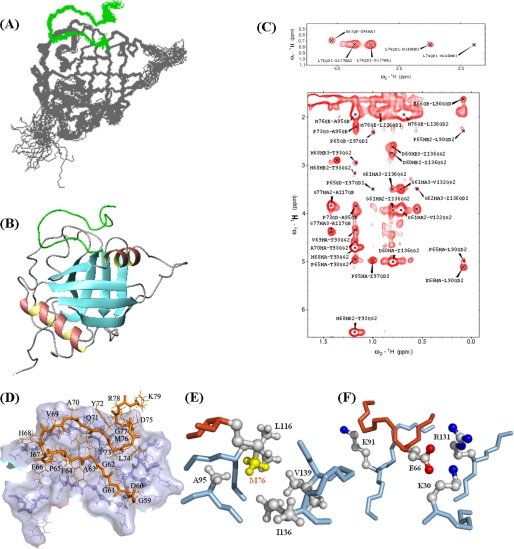
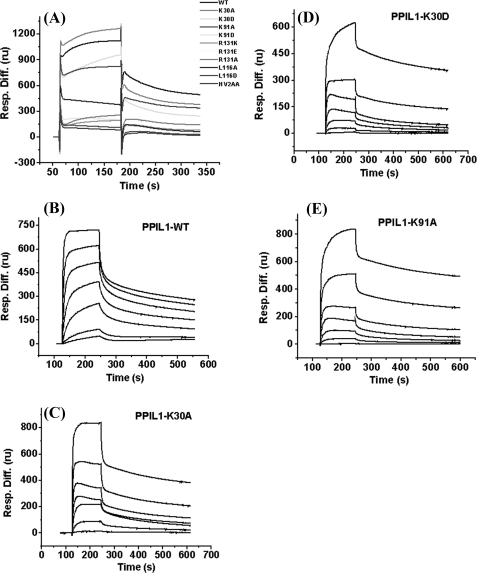
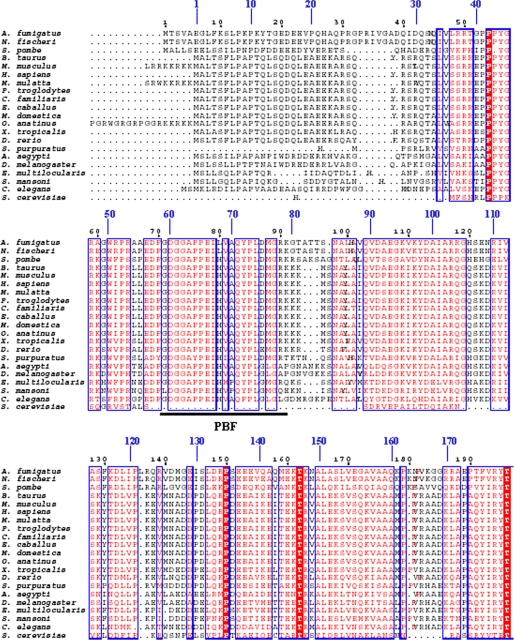
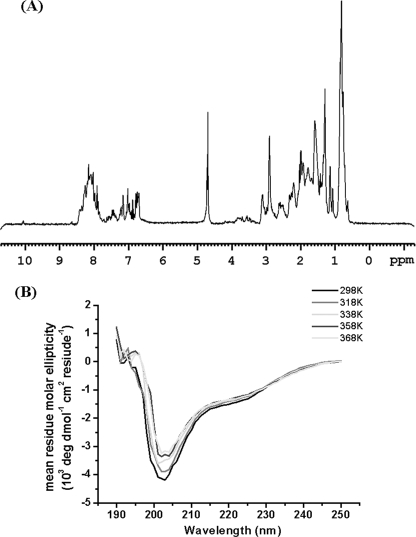
Intrinsically disordered proteins or protein regions play an important role in fundamental biological processes. During spliceosome activation, a large structural rearrangement occurs. The Prp19 complex and related factors are involved in the catalytic activation of the spliceosome. Recent mass spectrometric analyses have shown that Ski interaction protein (SKIP) and peptidylprolyl isomerase-like protein 1 (PPIL1) are Prp19-related factors that constitute the spliceosome B, B*, and C complexes. Here, we report that a highly flexible region of SKIP (SKIPN, residues 59-129) is intrinsically disordered. Upon binding to PPIL1, SKIPN undergoes a disorder-order transition. A highly conserved fragment of SKIP (residues 59-79) called the PPIL1-binding fragment (PBF) was sufficient to bind PPIL1. The structure of PBF.PPIL1 complex, solved by NMR, shows that PBF exhibits an ordered structure and interacts with PPIL1 through electrostatic and hydrophobic interactions. Three subfragments in the PBF (residues 59-67, 68-73, and 74-79) show hook-like backbone structure, and interactions between these subfragments are necessary for PBF.PPIL1 complex formation. PPIL1 is a cyclophilin family protein. It is recruited by SKIP into the spliceosome by a region other than the peptidylprolyl isomerase active site. This enables the active site of PPIL1 to remain open in the complex and still function as a peptidylprolyl cis/trans-isomerase or molecular chaperon to facilitate the folding of other proteins in the spliceosomes. The large disordered region in SKIP provides an interaction platform. Its disorder-order transition, induced by PPIL1 binding, may adapt the requirement for a large structural rearrangement occurred in the activation of spliceosome.
Figures
Similar articles
-
The crystal structure of PPIL1 bound to cyclosporine A suggests a binding mode for a linear epitope of the SKIP protein.PLoS One. 2010 Apr 2;5(4):e10013. doi: 10.1371/journal.pone.0010013. PLoS One. 2010. PMID: 20368803 Free PMC article.
-
Solution structure of human peptidyl prolyl isomerase-like protein 1 and insights into its interaction with SKIP.J Biol Chem. 2006 Jun 9;281(23):15900-8. doi: 10.1074/jbc.M511155200. Epub 2006 Apr 4. J Biol Chem. 2006. PMID: 16595688
-
Mutations in Spliceosomal Genes PPIL1 and PRP17 Cause Neurodegenerative Pontocerebellar Hypoplasia with Microcephaly.Neuron. 2021 Jan 20;109(2):241-256.e9. doi: 10.1016/j.neuron.2020.10.035. Epub 2020 Nov 20. Neuron. 2021. PMID: 33220177 Free PMC article.
-
Structural and Functional Insights into Human Nuclear Cyclophilins.Biomolecules. 2018 Dec 4;8(4):161. doi: 10.3390/biom8040161. Biomolecules. 2018. PMID: 30518120 Free PMC article. Review.
-
The dodo gene family encodes a novel protein involved in signal transduction and protein folding.Gene. 1997 Dec 12;203(2):89-93. doi: 10.1016/s0378-1119(97)00522-2. Gene. 1997. PMID: 9426238 Review.
Cited by
-
Sequence complexity of amyloidogenic regions in intrinsically disordered human proteins.PLoS One. 2014 Mar 3;9(3):e89781. doi: 10.1371/journal.pone.0089781. eCollection 2014. PLoS One. 2014. PMID: 24594841 Free PMC article.
-
Roles of Prolyl Isomerases in RNA-Mediated Gene Expression.Biomolecules. 2015 May 18;5(2):974-99. doi: 10.3390/biom5020974. Biomolecules. 2015. PMID: 25992900 Free PMC article. Review.
-
From Drosophila to humans: reflections on the roles of the prolyl isomerases and chaperones, cyclophilins, in cell function and disease.J Neurogenet. 2012 Jun;26(2):132-43. doi: 10.3109/01677063.2011.647143. Epub 2012 Feb 14. J Neurogenet. 2012. PMID: 22332926 Free PMC article. Review.
-
Molecular aspects of cyclophilins mediating therapeutic actions of their ligands.Cell Mol Life Sci. 2010 Oct;67(20):3467-88. doi: 10.1007/s00018-010-0437-0. Epub 2010 Jul 4. Cell Mol Life Sci. 2010. PMID: 20602248 Free PMC article. Review.
-
DISOPRED3: precise disordered region predictions with annotated protein-binding activity.Bioinformatics. 2015 Mar 15;31(6):857-63. doi: 10.1093/bioinformatics/btu744. Epub 2014 Nov 12. Bioinformatics. 2015. PMID: 25391399 Free PMC article.
References
Publication types
MeSH terms
Substances
Associated data
- Actions
LinkOut - more resources
Full Text Sources
Molecular Biology Databases
Research Materials
Miscellaneous
