. 2009 Dec 22;106(51):21643-8.
doi: 10.1073/pnas.0903827106. Epub 2009 Dec 9.

Temporal self-organization of the cyclin/Cdk network driving the mammalian cell cycle

Affiliations

Temporal self-organization of the cyclin/Cdk network driving the mammalian cell cycle

Claude Gérard et al. Proc Natl Acad Sci U S A. .

Abstract

We propose an integrated computational model for the network of cyclin-dependent kinases (Cdks) that controls the dynamics of the mammalian cell cycle. The model contains four Cdk modules regulated by reversible phosphorylation, Cdk inhibitors, and protein synthesis or degradation. Growth factors (GFs) trigger the transition from a quiescent, stable steady state to self-sustained oscillations in the Cdk network. These oscillations correspond to the repetitive, transient activation of cyclin D/Cdk4-6 in G(1), cyclin E/Cdk2 at the G(1)/S transition, cyclin A/Cdk2 in S and at the S/G(2) transition, and cyclin B/Cdk1 at the G(2)/M transition. The model accounts for the following major properties of the mammalian cell cycle: (i) repetitive cell cycling in the presence of suprathreshold amounts of GF; (ii) control of cell-cycle progression by the balance between antagonistic effects of the tumor suppressor retinoblastoma protein (pRB) and the transcription factor E2F; and (iii) existence of a restriction point in G(1), beyond which completion of the cell cycle becomes independent of GF. The model also accounts for endoreplication. Incorporating the DNA replication checkpoint mediated by kinases ATR and Chk1 slows down the dynamics of the cell cycle without altering its oscillatory nature and leads to better separation of the S and M phases. The model for the mammalian cell cycle shows how the regulatory structure of the Cdk network results in its temporal self-organization, leading to the repetitive, sequential activation of the four Cdk modules that brings about the orderly progression along cell-cycle phases.


Conflict of interest statement

The authors declare no conflict of interest.

Figures

Fig. 1.
Fig. 1.
Scheme of the model for the mammalian cell cycle. The model incorporates the four main cyclin/Cdk complexes centered on cyclin D/Cdk4–6, cyclin E/Cdk2, cyclin A/Cdk2, and cyclin B/Cdk1. Also considered are the effect of the GF and the role of the pRB/E2F pathway, which controls cell-cycle progression. Cyclin D/Cdk4–6 and cyclin E/Cdk2 elicit progression in G1 and the G1/S transition by phosphorylating and inhibiting pRB. The active, unphosphorylated form of pRB inhibits the transcription factor E2F, which promotes cell-cycle progression by inducing the synthesis of cyclins D, E, and A. Additional regulatory interactions are described in section 1 of SI Appendix where more detailed schemes for the whole network and each of its four modules are shown in Figs. S1 and S2. The combined effect of regulatory interactions between the four modules allows the cell to progress in a repetitive, oscillatory manner along the successive phases of the cell cycle, as depicted to the right.
Fig. 2.
Fig. 2.
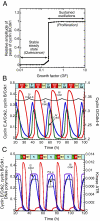
GF-induced oscillations in the Cdk network. (A) Below a sharp threshold in the concentration of GF, the Cdk network evolves to a stable steady state, whereas sustained oscillations occur above the threshold that corresponds to a bifurcation beyond which the steady state becomes unstable (see also Fig. 4). (B) Sustained oscillations correspond to the repetitive, ordered activation of the four cyclin/Cdk complexes. Cyclin D/Cdk4–6 and cyclin E/Cdk2 control progression in G1 and elicit the G1/S transition, whereas cyclin A/Cdk2 allows progression into S and G2. Finally, the peak in cyclin B/Cdk1 brings about the G2/M transition. The curves were generated by numerical integration of kinetic Eqs. 139 listed in section 2 of SI Appendix, for the parameter values listed in Table S2. Shown are the oscillations in the active forms of the cyclin/Cdk complexes. For cyclin D/Cdk4–6 the curve shows the evolution of the sum of the free form of the complex and its form bound to p21/p27. The oscillations are of the limit cycle type, i.e., they correspond in the phase plane to a unique closed trajectory (see Fig. 4B) that can be reached regardless of initial conditions. (C) Effect of the ATR/Chk1 checkpoint. The inclusion of the checkpoint lengthens the period, reduces the width of the peak in Cdk1, and results in a better separation of the peaks in cyclin E/Cdk2 and cyclin B/Cdk1. The curves showing the time evolution of cyclin E/Cdk2, cyclin B/Cdk1, DNA polymerase α, and kinase ATR were obtained by numerical integration of Eqs. 144 from SI Appendix for the parameter values listed in Table S2, with kce = 0.24 h−1 instead of 0.29 h−1 to further reduce the width in the peak of Cdk1. Concentrations are tentatively expressed in units of μM (see Table S2).
Fig. 3.
Fig. 3.
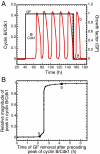
Restriction point in G1. (A) When GF is removed early in G1 (vertical dashed line), the Cdk network returns directly to a stable steady state without producing the peak in cyclin B/Cdk1 associated with the G2/M transition (curve a). In contrast, when GF is removed slightly later in G1, after a critical time that defines the restriction point, cells complete the cell cycle, triggered by a peak in cyclin B/Cdk1 (curve b), before returning to G0. (B) The existence of a restriction point in G1 is reflected by the sharp threshold in the curve showing the magnitude of the peak in cyclin B/Cdk1 relative to the magnitude of the preceding peak in the presence of a suprathreshold level of GF, as a function of the time at which GF is removed after the preceding peak. In the case considered, the restriction point occurs ≈2.6 h after the end of the preceding cell cycle. The curves were generated by numerical integration as described in Fig. 2B for the same set of parameter values.
Fig. 4.
Fig. 4.
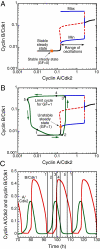
Origin and mechanism of oscillatory behavior in the Cdk network driving the mammalian cell cycle. (A) Bifurcation diagram for the cyclin B/Cdk1 module. As a function of cyclin A/Cdk2 considered as a control parameter, black lines represent stable steady states, blue lines represent the minimum and maximum of the oscillations in cyclin B/Cdk1, and the red dashed line represents the unstable steady state. The stable steady state in the absence of GF is shown by an orange square. The bifurcation diagram indicates that sustained oscillations occur in the cyclin B/Cdk1 module when the level of cyclin A/Cdk2 exceeds a critical value. This situation prevails only in the presence of sufficient amounts of GF (see Fig. 2A). (B) Superimposed on the bifurcation diagram of A, the green curve shows the trajectory followed by the full system of 39 variables in the course of sustained oscillations, in conditions where the steady state (orange dot) is unstable, for GF = 1. This limit cycle trajectory represents a projection onto the cyclin B/Cdk1 versus cyclin A/Cdk2 phase plane, where cyclin A/Cdk2 now behaves as a variable, according to Eq. 22 in SI Appendix. Arrows indicate the direction of movement along the periodic trajectory. (C) Sustained oscillations. The vertical lines drawn at successive phases over one period of the oscillations correspond to points 1–5 on the limit cycle in B. The limit cycle in B and the curves in C were generated as in Fig. 2B, for the same set of parameter values, in the absence of the ATR/Chk1 checkpoint. As indicated in Fig. 2C, oscillations also occur in the presence of this checkpoint, with a narrower peak in Cdk1. Using cyclin A/Cdk2 as a parameter, the bifurcation diagram in A was established by means of the program AUTO (49) applied to the kinetic equations of the cyclin B/Cdk1 module, i.e., Eqs. 2632 and 3439 in SI Appendix from which the terms related to p27 were removed, so as to keep this module isolated from the other modules. The unstable steady state for GF = 1 in B was located by means of AUTO applied to Eqs. 139 in SI Appendix.
Fig. 5.
Fig. 5.
The Cdk network controlling the mammalian cell cycle contains multiple oscillatory circuits. Schematized are four circuits containing negative feedback loops that are capable of generating sustained oscillations in the model for the mammalian cell cycle. Cyclin A/Cdk2 is present in the four circuits, each of which can generate on its own sustained oscillations. In circuits 1 and 2, oscillations can occur in the absence of cyclin B/Cdk1, which is responsible for the entry of cells into mitosis. Oscillations in Cdk2, which controls DNA replication, occur in these circuits without any peak in Cdk1, a phenomenon known as endoreplication (28). In oscillatory circuits 3 and 4, mitotic oscillations involving repetitive activation of cyclin B/Cdk1 can occur, based on a negative feedback exerted via the protein Cdc20, which allows the degradation of either cyclin A or cyclin B in these circuits. In physiological conditions, all four oscillatory circuits synchronize to produce the ordered, repetitive activation of the different modules forming the Cdk network that drives the mammalian cell cycle.

Similar articles

Cited by

References

    1. Pardee AB. A restriction point for control of normal animal cell proliferation. Proc Natl Acad Sci USA. 1974;71:1286–1290. - PMC - PubMed
    1. Blagosklonny MV, Pardee AB. The restriction point of the cell cycle. Cell Cycle. 2002;1:103–110. - PubMed
    1. Morgan DO. The Cell Cycle: Principles of Control. Oxford: Oxford Univ Press; 2006.
    1. Nurse P. Cyclin-dependent kinases and cell cycle control. ChemBioChem. 2002;3:596–603. - PubMed
    1. Malumbres M, Barbacid M. Mammalian cyclin-dependent kinases. Trends Biochem Sci. 2005;30:630–641. - PubMed

Publication types