. 2009 Dec 9;29(49):15355-65.
doi: 10.1523/JNEUROSCI.3005-09.2009.

The lysosomal sialic acid transporter sialin is required for normal CNS myelination

Affiliations

The lysosomal sialic acid transporter sialin is required for normal CNS myelination

Laura M Prolo et al. J Neurosci. .

Abstract

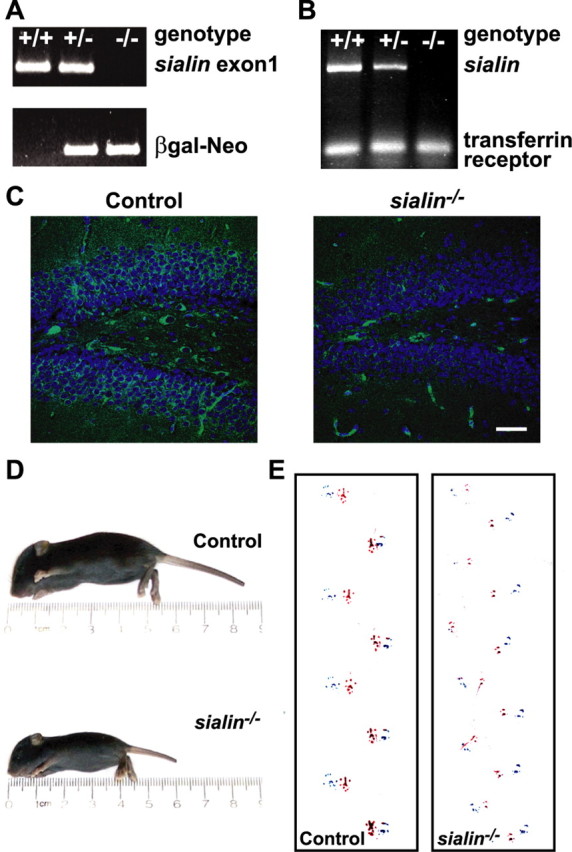
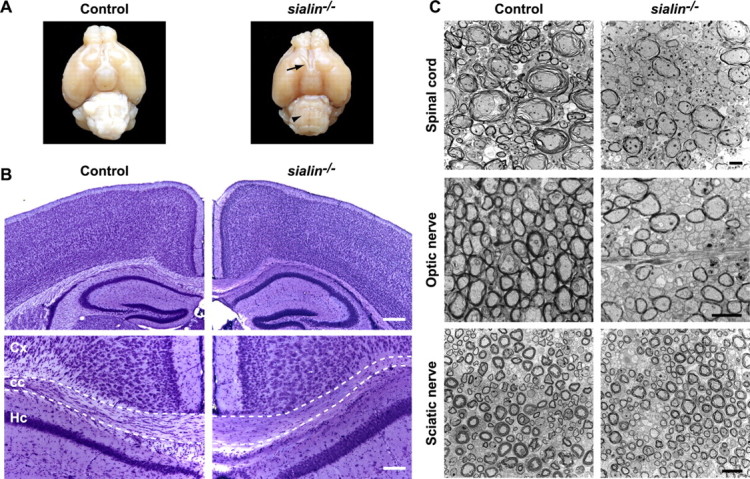
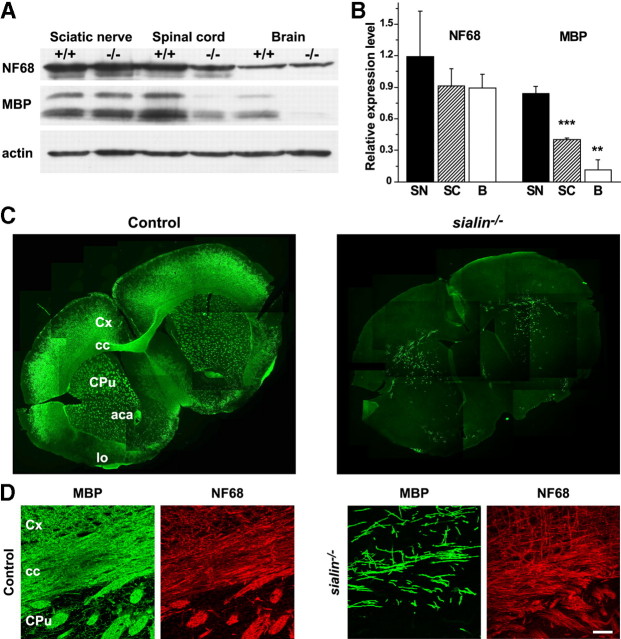
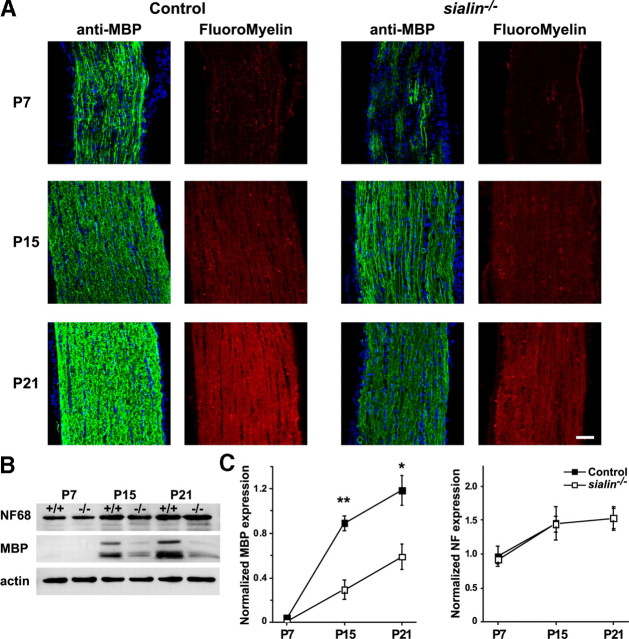
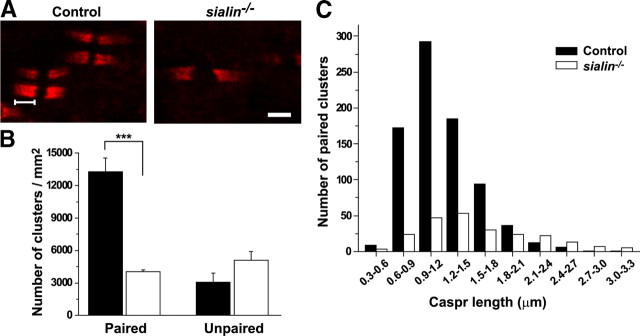
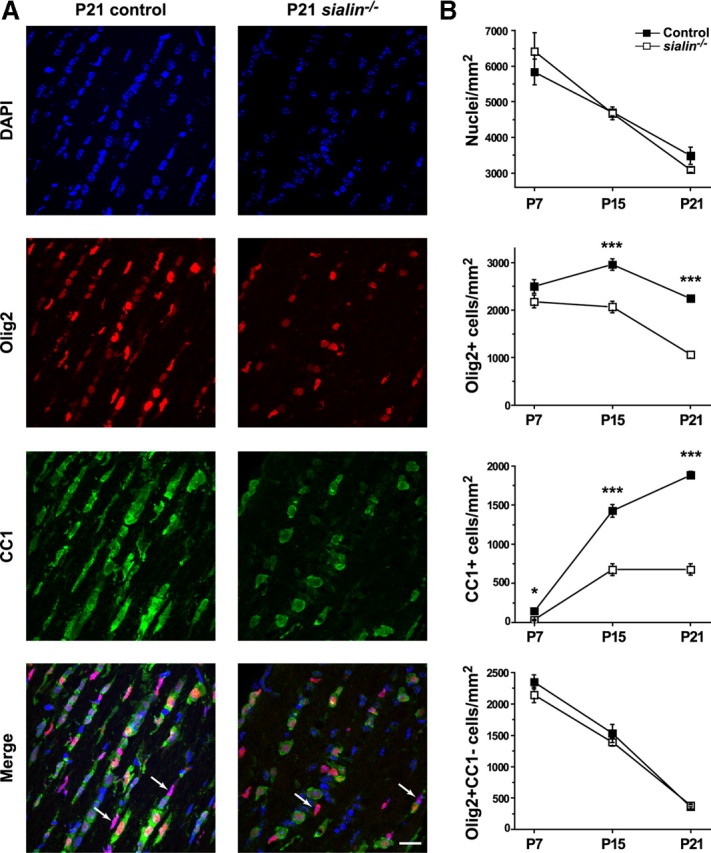
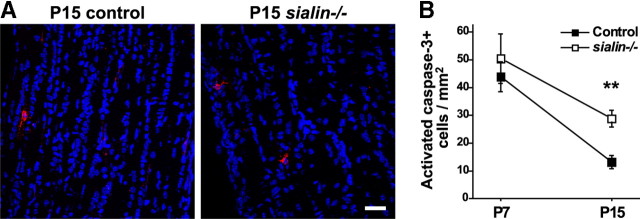
Salla disease and infantile sialic acid storage disease are autosomal recessive lysosomal storage disorders caused by mutations in the gene encoding sialin, a membrane protein that transports free sialic acid out of the lysosome after it is cleaved from sialoglycoconjugates undergoing degradation. Accumulation of sialic acid in lysosomes defines these disorders, and the clinical phenotype is characterized by neurodevelopmental defects, including severe CNS hypomyelination. In this study, we used a sialin-deficient mouse to address how loss of sialin leads to the defect in myelination. Behavioral analysis of the sialin(-/-) mouse demonstrates poor coordination, seizures, and premature death. Analysis by histology, electron microscopy, and Western blotting reveals a decrease in myelination of the CNS but normal neuronal cytoarchitecture and normal myelination of the PNS. To investigate potential mechanisms underlying CNS hypomyelination, we studied myelination and oligodendrocyte development in optic nerves. We found reduced numbers of myelinated axons in optic nerves from sialin(-/-) mice, but the myelin that was present appeared grossly normal. Migration and density of oligodendrocyte precursor cells were normal; however, a marked decrease in the number of postmitotic oligodendrocytes and an associated increase in the number of apoptotic cells during the later stages of myelinogenesis were observed. These findings suggest that a defect in maturation of cells in the oligodendrocyte lineage leads to increased apoptosis and underlies the myelination defect associated with sialin loss.


Figures

Figure 1.
Figure 1.
sialin−/− mice are small and uncoordinated. A, PCR amplification of genomic DNA with primers designed to detect the presence of exon 1 (top bands) and properly targeted β-galactosidase–neomycin gene (bottom bands) readily distinguishes wild-type (+/+), heterozygous (+/−), and homozygous mutant (−/−) animals. B, Analysis of RT-PCR of liver RNA with oligonucleotides designed to amplify exons 5–11 of sialin demonstrates the highest level of expression in wild-type animals, an intermediate level in heterozygous animals, and no detectable transcript in homozygous sialin mutant mice. RT-PCR of the transferrin receptor transcript was done to confirm the integrity of the samples. C, Immunofluorescence staining of the hippocampus from P21 mice with an anti-sialin antibody demonstrates strong expression in the granular layer and hilar neurons of the dentate gyrus in a heterozygous mouse (left) that is absent in a sialin−/− mouse (right). Nuclei are counterstained with DAPI. Background staining of blood vessels is seen in both images. D, P10 sialin mutant mice are smaller than age matched littermates. E, Representative footprint patterns from P21 control (left) and sialin−/− (right) mice show distinctly different strides. Stride lengths of sialin−/− mice are shorter (32.5 ± 1.1 vs 48.9 ± 3.6 mm; n = 3; ***p ≤ 0.001) and more variable (CV of 15.9 ± 1.6 vs 9.2 ± 1.5%; n = 3; *p ≤ 0.05). Scale bar, 150 μm.
Figure 2.
Figure 2.
sialin−/− mouse brains have normal cortical cytoarchitecture but reduced CNS myelin. A, Gross examination from the ventral view of P21 control (left) and sialin−/− (right) mouse brains indicates decreased bulk of the brainstem (arrowhead), thinned optic nerves (arrow), and no appreciable postchiasmatic optic tracts in sialin−/− mouse brain. B, Representative images of cresyl violet-stained coronal brain sections from P21 control (left) and sialin−/− (right) mice. Brains from sialin−/− mice show normal cortical lamination and hippocampal formation with thinning of the corpus callosum as the most prominent defect (top). Decreased cellularity of the corpus callosum (outlined) is evident on higher magnification in the bottom images. Cx, Cortex; cc, corpus callosum; Hc, hippocampus. C, Ultrastructure images of P21 control (left) and sialin−/− (right) mouse cervical spinal cord (top), optic nerve (middle), and sciatic nerve (bottom) cut in cross section demonstrate a decrease in the number of myelinated axons in the ventral white matter of the spinal cord and optic nerve of the sialin−/− animals, whereas myelination of the sciatic nerve appears normal. Scale bars: B, top, 200 μm; bottom, 100 μm; C, top and middle, 2 μm; bottom, 10 μm.
Figure 3.
Figure 3.
sialin−/− mice have reduced CNS myelin protein expression. A, Representative Western blot of PNS and CNS tissue from P21 sialin−/− and control mice demonstrates that levels of neurofilament (NF68) in sciatic nerve, cervical spinal cord, and brain are comparable between sialin−/− and control littermates. Expression of MBP is similar in sciatic nerves of sialin−/− and control mice but markedly reduced in spinal cord and brain of sialin−/− mice compared with controls. Actin levels are equivalent across samples. B, Quantification of Western blots demonstrates that these differences are consistent across samples. Values are mean ± SEM expression levels of protein in sialin−/− mouse tissue relative to control tissue (n = 3; **p ≤ 0.01, ***p ≤ 0.001; one population t test). SN, sciatic nerve; SC, spinal cord; B, brain. C, Immunofluorescence staining of coronal sections of P28 mouse brains for MBP (green) shows intense expression throughout the corpus callosum (cc), cortex (cx), striatum (CPu), anterior commissure (aca), and lateral olfactory tract (lo) in the control brain (left) but sparse staining throughout the sialin−/− brain (right). D, Higher magnification of P21 immunostained sections showing the cortex, corpus callosum, and striatum. The density of MBP staining (green) structures is substantially lower in the sialin−/− brain (right) compared with the control brain (left). Density of NF68-immunoreactive axons (red) is comparable between control and sialin−/− brains. Scale bar, 40 μm.
Figure 4.
Figure 4.
Myelin maturation is delayed in the optic nerves of sialin−/− mice. A, Representative longitudinal sections of optic nerves from P7 (top), P15 (middle), and P21 (bottom) mice demonstrate increasing expression of MBP (green) and intensity of the lipophilic dye Fluoromyelin Red staining with age in control (left) and sialin−/− (right) optic nerves. At all ages, both MBP immunostaining and Fluoromyelin Red staining are more intense in the control animals. B, Western blot of optic nerve protein expression during development indicates that NF68 expression is similar in control and sialin−/− at P7, P15, and P21. Although the level of MBP expression increases with age in both genotypes, less protein is expressed in the sialin−/− optic nerve compared with control at each age. Actin levels are equivalent across samples. C, Quantification of Western blot data shows MBP expression normalized to actin expression increases with age with less MBP expression in sialin−/− optic nerves compared with control optic nerves (n = 3; *p ≤ 0.05, **p ≤ 0.01). Levels of NF68 expression are indistinguishable between sialin−/− and control optic nerves. Scale bar, 40 μm.
Figure 5.
Figure 5.
Caspr clusters in sialin−/− mouse optic nerves are fewer in number and more variable in length. A, Longitudinal sections of optic nerves from P21 control (left) and sialin−/− (right) mice immunolabeled with antibodies against the paranodal protein Caspr. B, Average number of paired (left) and unpaired (right) Caspr clusters in control (black bar) and sialin−/− (white bar) optic nerves. There is a significant decrease in paired Caspr clusters in sialin−/− optic nerves compared with control optic nerves (n = 4; ***p ≤ 0.001) but a similar density of unpaired clusters. C, Histogram showing the distribution in length of paired Caspr clusters (bracketed line in A) in control (black bars) and sialin−/− (white bars) optic nerves. The average length of Caspr clusters was greater in the sialin−/− optic nerves (1.60 ± 0.04, mean ± SEM; n = 4) than in control optic nerves (1.19 ± 0.01 μm). Scale bar, 2 μm.
Figure 6.
Figure 6.
The number of mature oligodendrocytes is decreased in sialin−/− mouse optic nerves. A, Immunohistochemical analysis of optic nerve longitudinal sections. Oligodendrocytes are labeled with antibodies recognizing Olig2 (red) and CC1 (green) in P21 control (left) and sialin−/− (right) optic nerves. Nuclei are counterstained with DAPI (blue). Note the decreased number and the round morphology of CC1+ cells in sialin−/− optic nerves compared with the linear chains of elongated CC1+ cells in control optic nerves. Arrows identify Olig2+/CC1 cells. B, Quantification of cell types in P7, P15, and P21 optic nerves. The number of CC1+ cells plateaus in sialin−/− at P15 but continues to increase in control optic nerves. Average ± SEM was obtained from three to five pairs of control and sialin−/− animals from each time point (*p ≤ 0.05, ***p ≤ 0.001). Scale bar, 20 μm.
Figure 7.
Figure 7.
Loss of sialin leads to increased apoptosis. A, Longitudinal sections of P15 optic nerves immunolabeled for activated caspase-3 (red) demonstrates increased apoptosis in sialin−/− (right) compared with control (left) optic nerves. B, Quantification of the density of activated caspase-3+ cells in P7 and P15 optic nerves of control and sialin−/− mice. The number of apoptotic cells was normalized to the surface area of the optic nerve (n = 4–6; **p ≤ 0.01). Scale bar, 40 μm.
Figure 8.
Figure 8.
Downregulation of PSA-NCAM expression is impaired in sialin−/− mouse optic nerves. A, Western blot of optic nerve samples indicates that PSA-NCAM expression decreases during development from P7 to P21 in control and sialin−/− mice. However, at P15 and P21, relative expression is greater in the sialin−/− animals. Actin expression serves as a loading control. B, Quantification of Western blots demonstrates consistency across samples. Values are mean ± SEM relative expression levels of PSA-NCAM (normalized to actin) in sialin−/− mouse optic nerves relative to control optic nerves (n = 3; *p ≤ 0.05; one population t test).

Similar articles

Cited by

References

    1. Aula N, Salomäki P, Timonen R, Verheijen F, Mancini G, Månsson JE, Aula P, Peltonen L. The spectrum of SLC17A5-gene mutations resulting in free sialic acid-storage diseases indicates some genotype-phenotype correlation. Am J Hum Genet. 2000;67:832–840. - PMC - PubMed
    1. Autio-Harmainen H, Oldfors A, Sourander P, Renlund M, Dammert K, Simila S. Neuropathology of Salla disease. Acta Neuropathol. 1988;75:481–490. - PubMed
    1. Barranger JA, Cabrera-Salazar MA. Lysosomal storage disorders. New York: Springer; 2007.
    1. Barres BA. The mystery and magic of glia: a perspective on their roles in health and disease. Neuron. 2008;60:430–440. - PubMed
    1. Barres BA, Hart IK, Coles HS, Burne JF, Voyvodic JT, Richardson WD, Raff MC. Cell death and control of cell survival in the oligodendrocyte lineage. Cell. 1992;70:31–46. - PubMed

Publication types

MeSH terms