. 2009 Dec 9;29(49):15375-85.
doi: 10.1523/JNEUROSCI.3126-09.2009.

Phospholipase C beta 4 in the medial septum controls cholinergic theta oscillations and anxiety behaviors

Affiliations

Phospholipase C beta 4 in the medial septum controls cholinergic theta oscillations and anxiety behaviors

Jonghan Shin et al. J Neurosci. .

Abstract

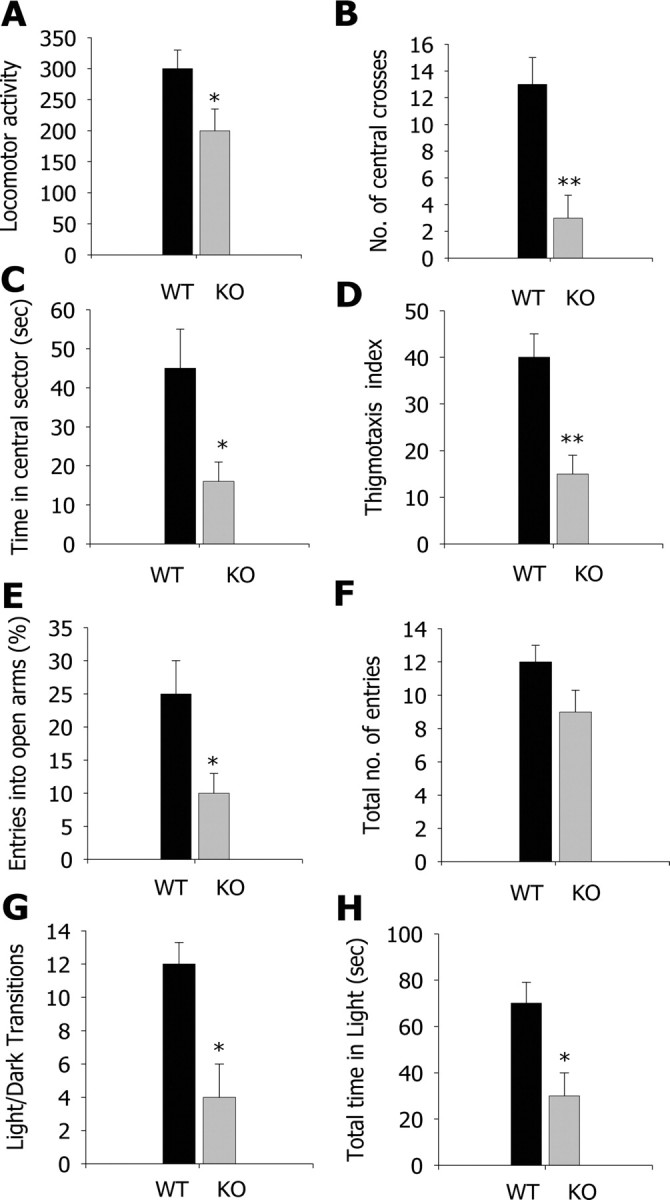
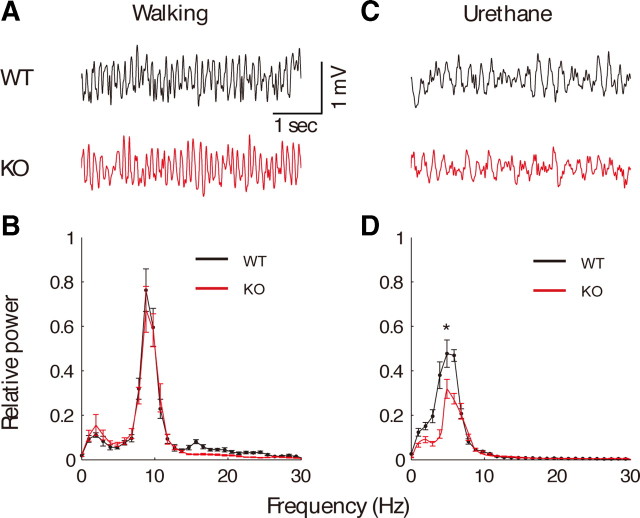
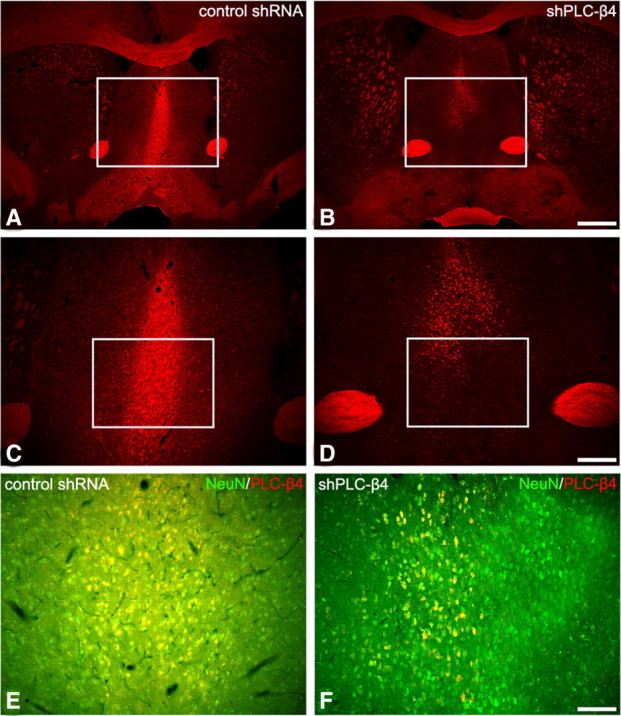
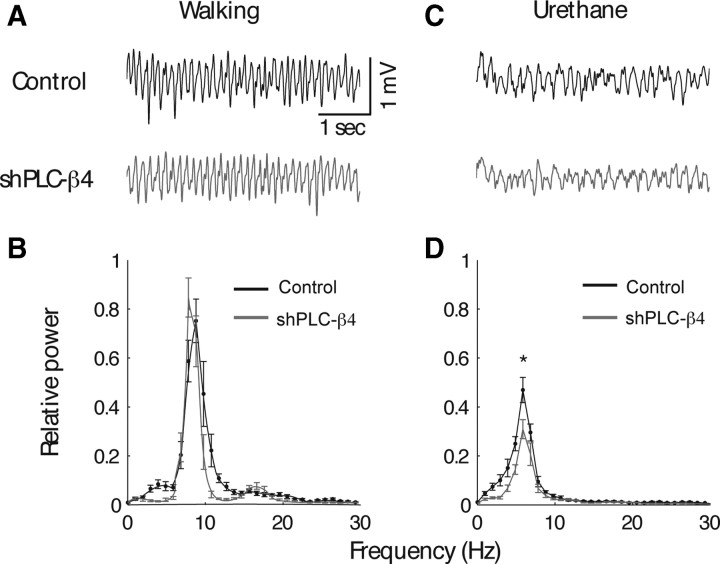
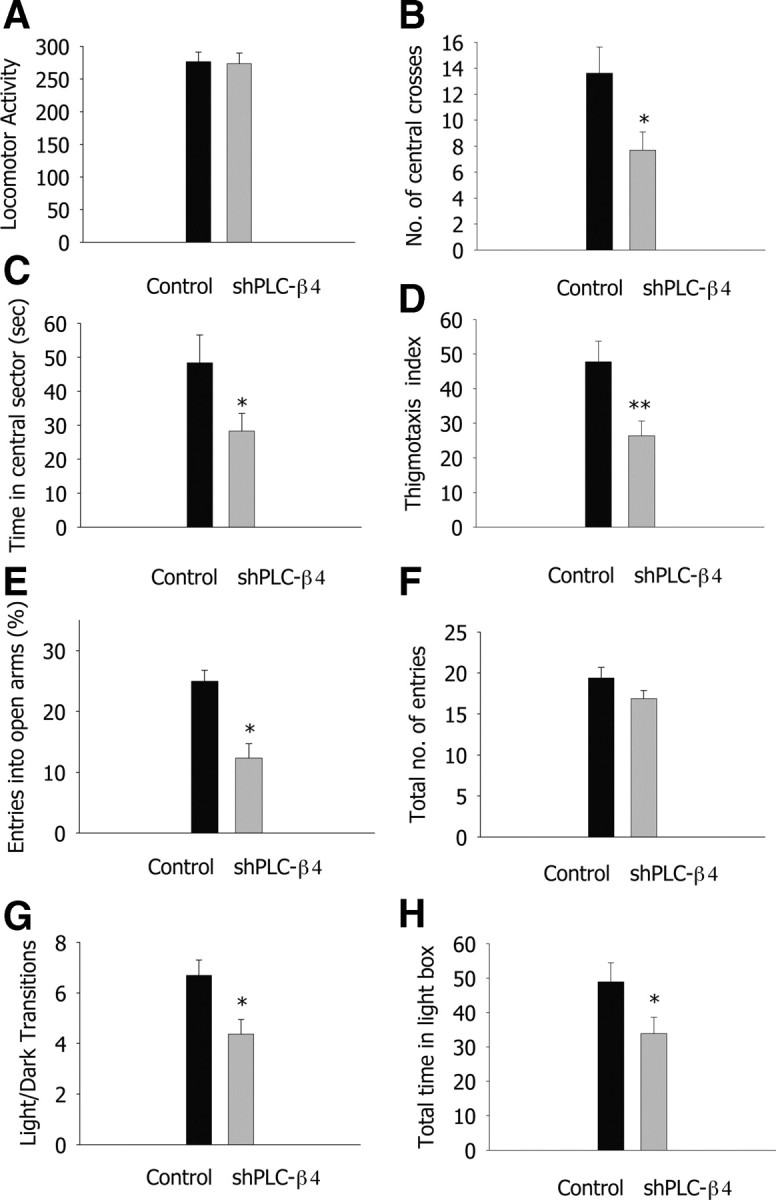
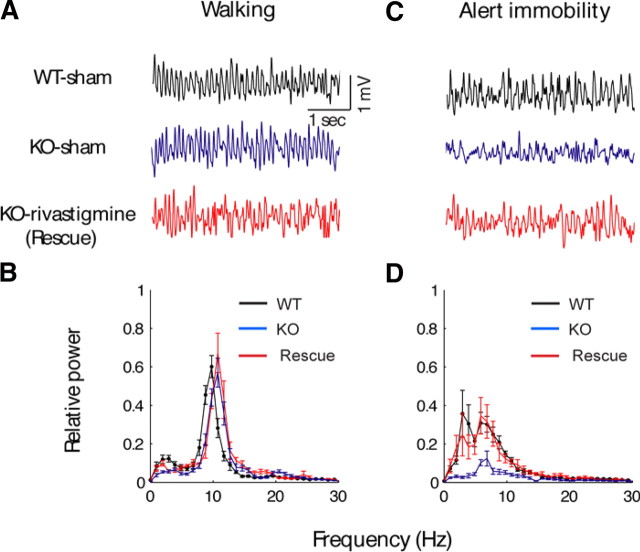
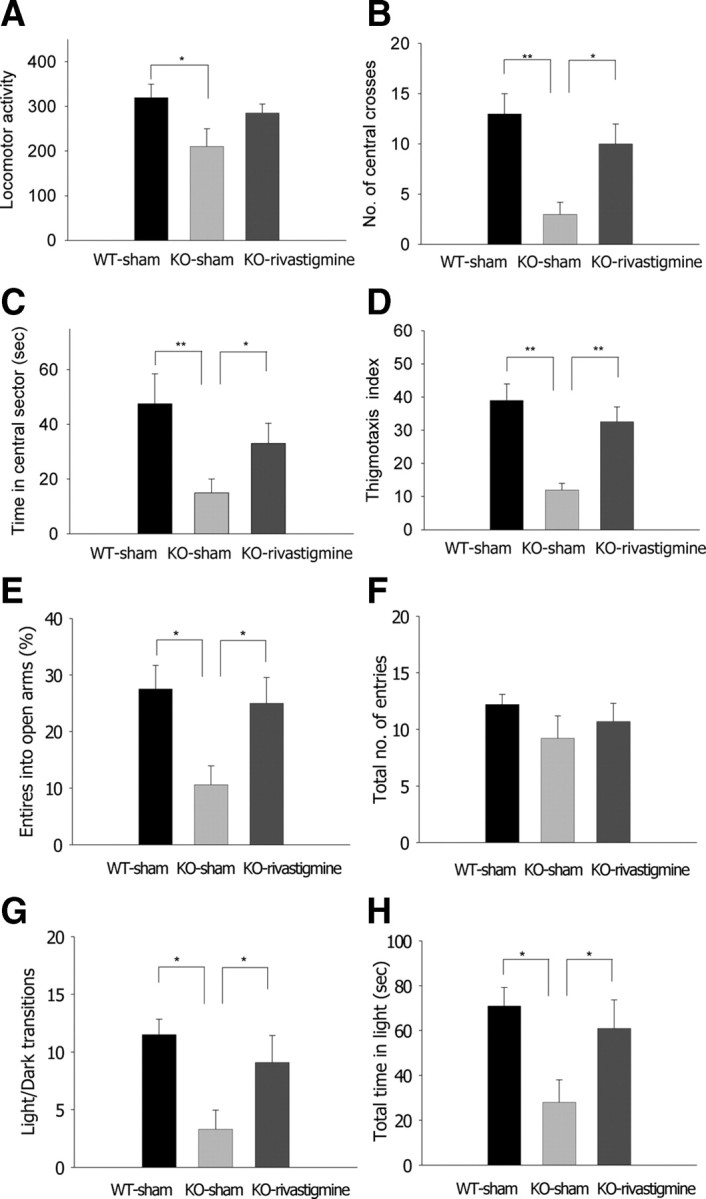
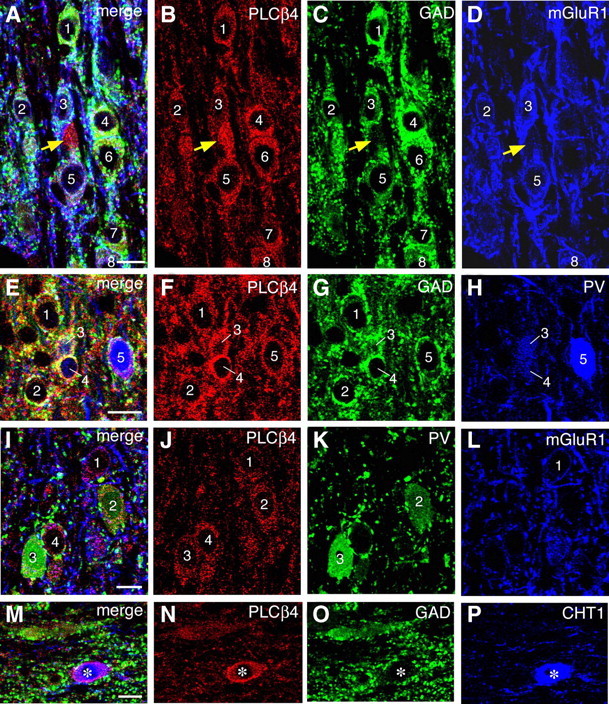
Anxiety is among the most prevalent and costly diseases of the CNS, but its underlying mechanisms are not fully understood. Although attenuated theta rhythms have been observed in human subjects with increased anxiety, no study has been done on the possible physiological link between these two manifestations. We found that the mutant mouse for phospholipase C beta 4 (PLC-beta 4(-/-)) showed attenuated theta rhythm and increased anxiety, presenting the first animal model for the human condition. PLC-beta 4 is abundantly expressed in the medial septum, a region implicated in anxiety behavior. RNA interference-mediated PLC-beta 4 knockdown in the medial septum produced a phenotype similar to that of PLC-beta 4(-/-) mice. Furthermore, increasing cholinergic signaling by administering an acetylcholinesterase inhibitor cured the anomalies in both cholinergic theta rhythm and anxiety behavior observed in PLC-beta 4(-/-) mice. These findings suggest that (1) PLC-beta 4 in the medial septum is involved in controlling cholinergic theta oscillation and (2) cholinergic theta rhythm plays a critical role in suppressing anxiety. We propose that defining the cholinergic theta rhythm profile may provide guidance in subtyping anxiety disorders in humans for more effective diagnosis and treatments.


Figures

Figure 1.
Figure 1.
Increased anxiety behavior in PLC-β4−/− mice in open-field, elevated plus-maze, and light/dark transition tests. A, Locomotor activity in the open field. B, Number of central crosses in the open field. C, Time in the central sector of the open field. D, Thigmotaxis index: the lower the index, the higher the thigmotaxis (see Materials and Methods for detail). E, Percentage entries into the open arms of the elevated plus-maze. F, Total number of entries in the elevated plus-maze. G, Light/dark transition number. H, Total time in the light compartment. *p < 0.05, **p < 0.01, two-tailed t test; all data are presented as means ± SEM from 10 mice per genotypes.
Figure 2.
Figure 2.
Intact noncholinergic theta rhythms and attenuated cholinergic theta rhythms in PLCβ-4−/− mice. A, Representative EEG waveforms during walking for wild-type mice (WT) and PLC-β4−/− mice (KO). B, Averaged power spectra of the EEG waveforms recorded during walking for wild-type mice (n = 7) and PLC-β4−/− mice (n = 7). C, Representative EEG waveforms during urethane anesthesia for wild-type mice (black trace) and PLC-β4−/− mice (red trace). D, Averaged power spectra of the EEG waveforms recorded during urethane anesthesia for wild-type mice (n = 7) and PLC-β4−/− mice (n = 7). *p < 0.05, two-tailed t test; all data are presented as means ± SEM.
Figure 3.
Figure 3.
PLC-β4 expression in the medial septum of control shRNA mice and shPLC-β4 mice (A–D). Immunofluorescence staining for PLC-β4 in the medial septal area of shPLC-β4 mice is significantly downregulated (B, D). A normal PLC-β4 expression pattern is observed in the control shRNA mice (A, C). The rectangles in A and B indicate regions of C and D. Scale bars: A, B, 280 μm; C, D, 100 μm. Coexpression of NeuN and PLC-β4 in control shRNA mice and shPLC-β4 mice (E, F). Immunofluorescence staining for PLC-β4 in NeuN-positive neurons is markedly reduced in the medial septum of shPLC-β4 mice (F), whereas its expression in NeuN-positive neurons of control shRNA mice is generally unchanged (E). The rectangles in C and D indicate regions of E and F. Scale bar: E, F, 50 μm.
Figure 4.
Figure 4.
Medial septum-selective PLC-β4 knockdown replicates the theta rhythm heterogeneity phenotype of PLC-β4−/− mice. A, Representative EEG waveforms during walking for wild-type mice injected with lentiviruses expressing control shRNA (control shRNA mice) and wild-type mice injected with lentivirus encoding shPLC-β4 (shPLC-β4 mice). B, Averaged power spectra of the EEG waveforms recorded during walking for control shRNA mice (n = 7) and shPLC-β4 mice (n = 7). C, Representative EEG waveforms during urethane anesthesia for control shRNA mice and shPLC-β4 mice. D, Averaged power spectra of the EEG waveforms recorded during urethane anesthesia for control shRNA mice (n = 7) and shPLC-β4 mice (n = 7). *p < 0.05, two-tailed t test; all data are presented as means ± SEM.
Figure 5.
Figure 5.
Medial septum-selective PLC-β4 knockdown replicates the anxiety behavior phenotype of PLC-β4−/− mice. A, Locomotor activity in the open field. B, Number of central crosses in the open field. C, Time in the central sector of the open field. D, Thigmotaxis index. E, Percentage entries into the open arms of the elevated plus-maze. F, Total number of entries in the elevated plus-maze. G, Light/dark transition number. H, Total time in the light compartment. *p < 0.05, **p < 0.01, ***p < 0.001, two-tailed t test; n = 13 for control shRNA mice and n = 16 for shPLC-β4 mice; all data are presented as means ± SEM from 10 mice per genotypes.
Figure 6.
Figure 6.
Rivastigmine rescues impaired cholinergic theta rhythms in PLC-β4−/− mice. A, Representative EEG waveforms during walking for wild-type mice with intraperitoneal injection of saline (WT-sham), PLC-β4−/− mice with intraperitoneal injection of saline (KO-sham), and PLC-β4−/− mice with intraperitoneal injection of rivastigmine (KO-rivastigmine). B, Averaged power spectra of the EEG waveforms recorded during walking for WT-sham (n = 10), KO-sham (n = 10), and KO-rivastigmine (n = 10). C, Representative EEG waveforms during alert immobility for WT-sham (black trace), KO-sham (blue trace), and KO-rivastigmine (red trace). D, Averaged power spectra of the EEG waveforms recorded during alert immobility for WT-sham (n = 10), KO-sham (n = 10), and KO-rivastigmine (n = 10). All data are presented as means ± SEM.
Figure 7.
Figure 7.
Rivastigmine rescues increased anxiety behavior of PLC-β4−/− mice. A, Locomotor activity in the open field. B, Number of central crosses in the open field. C, Time in the central sector of the open field. D, Thigmotaxis index. E, Percentage entries into the open arms of the elevated plus-maze. F, Total number of entries in the elevated plus-maze. G, Light/dark transition number. H, Total time in the light compartment. *p < 0.05, **p < 0.01, ANOVA; all data are presented as means ± SEM from 10 mice per group.
Figure 8.
Figure 8.
Triple immunofluorescence showing that PLC-β4 is detected in GABAergic neurons expressing mGluR1a and PV and in cholinergic neurons expressing CHT1. Triple labeling for PLC-β4, GAD, and mGluR1 (A–D), PLC-β4, GAD, and PV (E–H), PLC-β4, PV, and mGluR1 (I–L), and PLC-β4, GAD, and CHT1 (M–P). Labeled neurons are indicated by numerals. Note infrequent and intense PLC-β4 labeling in GAD-negative neuronal elements (A–D, yellow arrows), which are likely to represent cholinergic neurons expressing CHT1 (M–P). Scale bars, 10 μm.

References

    1. Apostolova LG, Cummings JL. Neuropsychiatric manifestations in mild cognitive impairment: a systematic review of the literature. Dement Geriatr Cogn Disord. 2008;25:115–126. - PubMed
    1. Bland BH. The physiology and pharmacology of hippocampal formation theta rhythms. Prog Neurobiol. 1986;26:1–54. - PubMed
    1. Bland BH, Oddie SD. Theta band oscillation and synchrony in the hippocampal formation and associated structures: the case for its role in sensorimotor integration. Behav Brain Res. 2002;127:119–136. - PubMed
    1. Buzsáki G. Theta oscillations in the hippocampus. Neuron. 2002;33:325–340. - PubMed
    1. Cerbai F, Giovannini MG, Melani C, Enz A, Pepeu G. N1phenethyl-norcymserine, a selective butyrylcholinesterase inhibitor, increases acetylcholine release in rat cerebral cortex: a comparison with donepezil and rivastigmine. Eur J Pharmacol. 2007;572:142–150. - PubMed

Publication types

MeSH terms