. 2009 Dec 9;29(49):15397-409.
doi: 10.1523/JNEUROSCI.4339-09.2009.

Cytotoxic CD8+ T cell-neuron interactions: perforin-dependent electrical silencing precedes but is not causally linked to neuronal cell death

Affiliations

Cytotoxic CD8+ T cell-neuron interactions: perforin-dependent electrical silencing precedes but is not causally linked to neuronal cell death

Sven G Meuth et al. J Neurosci. .

Abstract

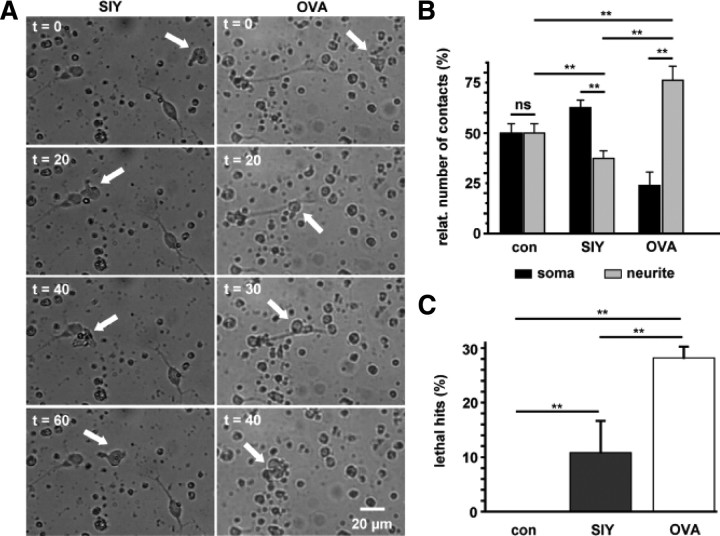
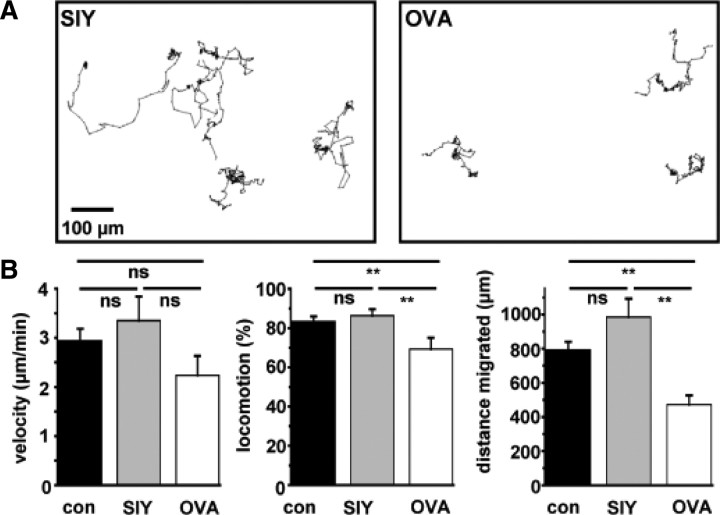
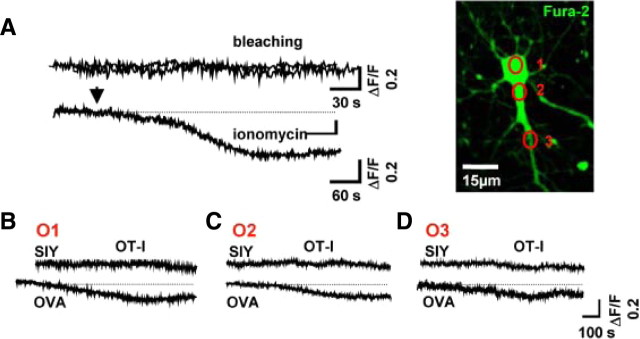
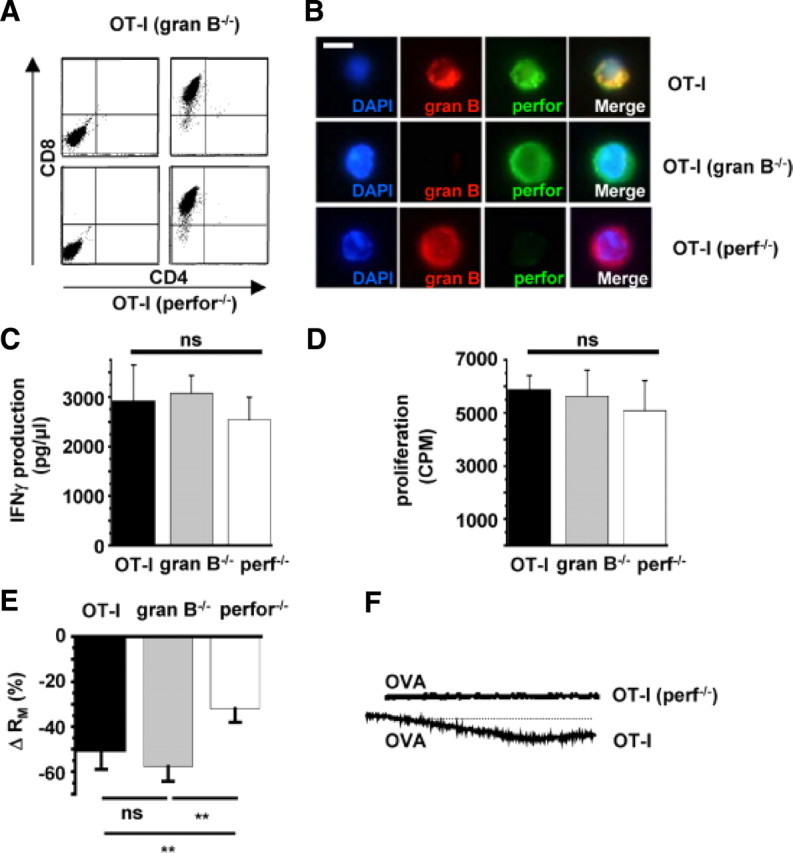
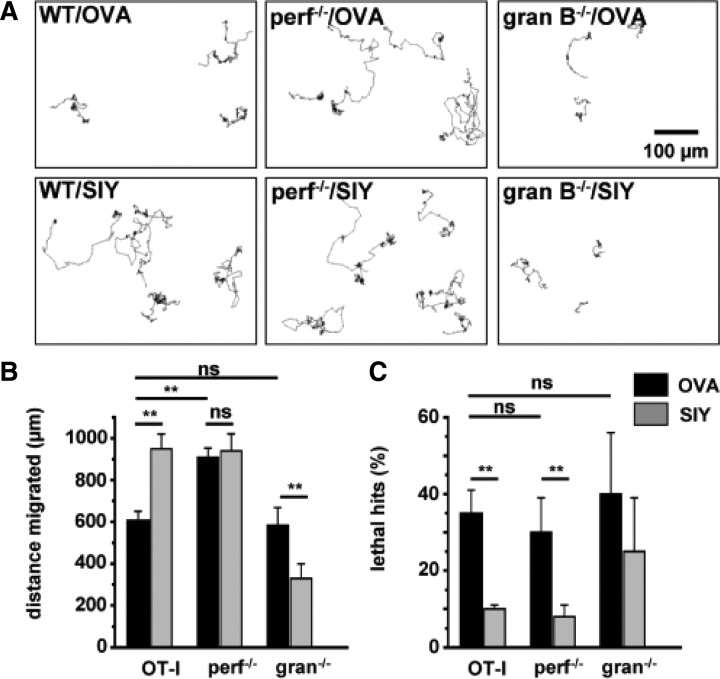
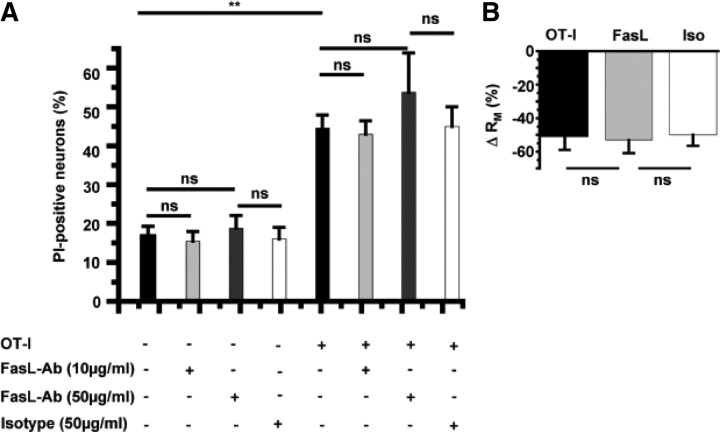
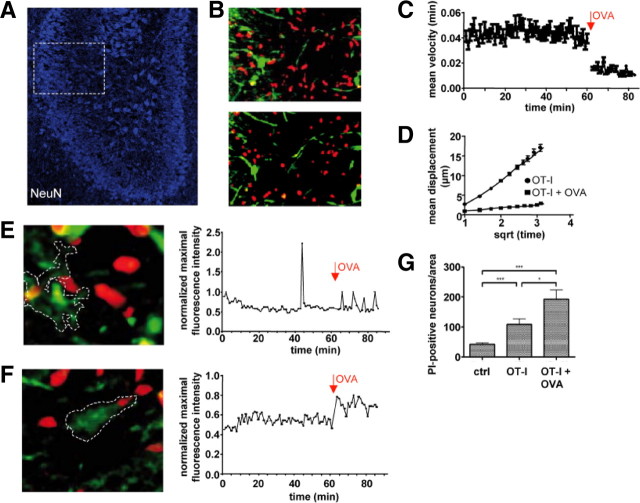
Cytotoxic CD8(+) T cells are considered important effector cells contributing to neuronal damage in inflammatory and degenerative CNS disorders. Using time-lapse video microscopy and two-photon imaging in combination with whole-cell patch-clamp recordings, we here show that major histocompatibility class I (MHC I)-restricted neuronal antigen presentation and T cell receptor specificity determine CD8(+) T-cell locomotion and neuronal damage in culture and hippocampal brain slices. Two separate functional consequences result from a direct cell-cell contact between antigen-presenting neurons and antigen-specific CD8(+) T cells. (1) An immediate impairment of electrical signaling in single neurons and neuronal networks occurs as a result of massive shunting of the membrane capacitance after insertion of channel-forming perforin (and probably activation of other transmembrane conductances), which is paralleled by an increase of intracellular Ca(2+) levels (within <10 min). (2) Antigen-dependent neuronal apoptosis may occur independently of perforin and members of the granzyme B cluster (within approximately 1 h), suggesting that extracellular effects can substitute for intracellular delivery of granzymes by perforin. Thus, electrical silencing is an immediate consequence of MHC I-restricted interaction of CD8(+) T cells with neurons. This mechanism is clearly perforin-dependent and precedes, but is not causally linked, to neuronal cell death.


Figures

Figure 1.
Figure 1.
Time-lapse video microscopy of OT-I T cell–neuron interactions. A, Migration and interaction of a stimulated OT-I T cell (white arrow) with a MHC I-expressing hippocampal neuron over 60 min in the presence of a control peptide (SIY, left column) and the appropriate OVA peptide (OVA, right column; see also corresponding video traces in Fig. 2A and supplemental Movies 1, 2, available at www.jneurosci.org as supplemental material). Scale bar, 20 μm (for all panels). B, Bar graph representation of T cell–neuron interaction sites [soma (black bars) vs neurites (gray bars)] under control conditions (con; n = 15) and after application of a control peptide (SIY; n = 23) or OVA peptide (OVA; n = 21). C, Percentage of T cell–neuron interactions leading to neuronal death as indicated by morphological changes (lethal hits) under control conditions (con; n = 15) and in the presence of a control peptide (SIY; n = 23) or OVA peptide (OVA; n = 21). Error bars represent mean ± SEM. **p < 0.05; ns, not significant.
Figure 2.
Figure 2.
Analysis of OT-I T cell migration under coculture condition with neuronal cells. A, Representative tracking traces of individual OT-I T cells under coculture conditions in the presence of a control peptide (SIY, left) and OVA peptide (OVA, right). B, Bar graph representation of the T-cell migration parameters velocity (micrometers per minute), locomotion (percentage of time a T cell migrates), and migrated distance (micrometers) under control conditions (con; n = 21), after application of control peptide (SIY; n = 31) and after application of OVA peptide (OVA; n = 29). Error bars represent mean ± SEM. **p < 0.05; ns, not significant.
Figure 3.
Figure 3.
Alteration of electrical properties of neurons during cell–cell contact with OT-I T cells. Whole-cell patch-clamp recordings of hippocampal neurons after establishing a cell–cell contact to an activated OT-I T cell. Neurons were held at −80 mV, and a sine-wave protocol (A, see inset; frequency of 500 Hz, voltage amplitude of 20 mV) was applied to determine passive electrical parameters. A, Representative recordings (left) and bar graph representation (right) of the CM under control conditions (con; n = 10), after intracellular application of the pore-forming agent nystatin (Nyst; 200 μg/ml; n = 12), and after attaching a single OT-I cell to the soma of the recorded neuron presenting a control peptide (SIY; n = 11) or OVA peptide (OVA; n = 12). B, Representative recordings (left) and bar graph representation (right) of changes in RS under control conditions (con; n = 10), after application of nystatin (Nyst; n = 12), and after neuron–T cell contact in the presence of a control peptide (SIY; n = 11) or OVA peptide (OVA; n = 12). C, Representative recordings (left) and bar graph representation (right) of changes in RM under control conditions (con; n = 10), after application of nystatin (Nyst; n = 12), and after neuron–T cell contact in the presence of the control peptide (SIY; n = 11) or OVA peptide (OVA; n = 12). Error bars represent mean ± SEM. **p < 0.05; ns, not significant.
Figure 4.
Figure 4.
Kinetics of neuronal Ca2+ influx are similar to the increased membrane conductance during OT-I T cell–neuron interaction. A, Representative Ca2+ imaging with bis-fura-2 under control conditions (bleaching) and after application of the Ca2+-pore-forming agent ionomycin. Bar graph representation of the fluorescence ratio (ΔF/F) under control conditions and after application of ionomycin (see inset). Picture indicates a representative cultured hippocampal neuron and regions of interest for Ca2+ signal detection after attachment of an OT-I T cell on the soma of the investigated neuron (ROI1, soma; ROI2, proximal neurite; ROI3, distal neurite). Scale bar, 15 μm. B–D, Representative Ca2+ imaging traces and bar graph representation of Ca2+ signals recorded after establishing a cell–cell contact between WT OT-I T cells and neurons in the presence of OVA peptide (OVA; n = 5) or a control peptide (SIY; n = 5) detected at the soma (B), the proximal neurite (C), and the distal neurite (D). Bis-fura-2 fluorescence is expressed as the raw fluorescence, so that decreases in bis-fura-2 fluorescence correspond to increasing [Ca2+]i.
Figure 5.
Figure 5.
Increased neuronal membrane conductance during OT-I T cell–neuron interaction is attributable to incorporation of perforin into the neuronal surface membrane. A, Flow cytometry of splenocytes from RAG-1−/− OT-I mice deficient for granzyme B (gran B−/−; top row) or perforin (perf−/−; bottom row) before (left column) and after (right column) in vitro stimulation with OVA and IL-2. Virtually all cells were CD8+ after 5 d of in vitro stimulation. B, Immunocytochemistry using specific antibodies raised against granzyme B (red, gran B) and perforin (green, perf). Cell nuclei were counterstained with DAPI (blue). Scale bar, 10 μm. C, IFN-γ production during CD3/CD28 bead stimulation of OT-I T cells and OT-I T cells deficient for granzyme B (gran B−/−) or perforin (perf−/−). D, Proliferation after CD3/CD28 bead stimulation of OT-I cells and OT-I cells deficient for granzyme B (granB−/−) or perforin (perf−/−) as indicated by [3H]thymidine incorporation. E, Bar graph representation of the alteration of RM after establishing cell–cell contact between WT OT-I cells, OT-I cells deficient for granzyme B cluster (gran B−/−), or perforin (perf−/−) and hippocampal neurons. F, Representative Ca2+ imaging traces of Ca2+ signals recorded after establishing a cell–cell contact between WT OT-I T cells (n = 8) and OT-I (perf−/−) T cells (n = 8) and neurons in the presence of OVA peptide detected at the soma. Scale bars like in Fig. 4B–D. Error bars represent mean ± SEM. **p < 0.05; ns, not significant.
Figure 6.
Figure 6.
Perforin and the granzyme B cluster are dispensable for neuronal death in OT-I T cell–neuron cocultures. A, Representative tracking of WT OT-I cells (left), OT-I cells deficient for perforin (perf−/−; middle), or OT-I cells deficient for granzyme B cluster (gran B−/−; right) in hippocampal neuron cocultures in the presence of the OVA peptide (OVA; top row) or a control peptide (SIY; bottom row). Scale bar, 100 μm. B, Bar graph representation of the migrated distance of OT-I T cells, OT-I T cells deficient for perforin (perf−/−), or granzyme B cluster (gran B−/−) in the presence of OVA peptide (OVA; black columns) or a control peptide (SIY; gray columns). C, Percentage of T cell–neuron interactions leading to neuronal death as indicated by morphological changes (lethal hits) of neurons after coculture with OT-I T cells or OT-I T cells deficient for perforin (perf−/−) or granzyme B (gran B−/−) in the presence of OVA peptide (OVA; black columns) or a control peptide (SIY; gray columns). Error bars represent mean ± SEM. **p < 0.05; ns, not significant.
Figure 7.
Figure 7.
FasL–Fas interactions contribute to neither alteration of electrical properties of neurons nor neuronal killing by OT-I T cells. A, Cell death after 6 h of OT-I neuron coculture under control conditions (con; n = 16) and in the presence of a neutralizing anti-FasL antibody (10 μg/ml, n = 16; 50 μg/ml, n = 8) and an isotypic control (50 μg/ml, n = 6) as assessed by DAPI/PI staining. B, RM of hippocampal neurons after interaction with OT-I cells in the absence and presence of a neutralizing anti-FasL antibody (10 μm/ml, n = 8; 50 μm/ml, n = 8) and an isotypic control (Iso; 50 μm/ml, n = 6). Error bars represent mean ± SEM. **p < 0.05; ns, not significant.
Figure 8.
Figure 8.
Migratory behavior of OT-I T cells and neuronal killing in hippocampal slices. A, Acute hippocampal slices contain high densities of visually detectable neurons (NeuN) in the CA region (white frame) and permit the study of WT OT-I T cell migration and their interaction with neurons in intact CNS parenchyma by two-photon microscopy. B, WT OT-I T cells migrating in the absence of the OVA peptide are characterized by a round leading edge and a trailing uropod (top). During antigen application, OT-I T cells become round and stationary (bottom) (supplemental Movie 3, available at www.jneurosci.org as supplemental material). C, Mean instantaneous velocity of WT OT-I T cells (0–60 min) and after application of 25 nm OVA peptide (62–85 min) in acute hippocampal slice cultures. D, MDP of OT-I T cells in the absence and presence of the cognate antigen. The decrease of the slope in the MDP plot indicates the switch from a randomly migrating to a stationary OT-I T cell population during addition of antigen. E, F, Cells (white frame) in the CA region were loaded with the calcium-indicator dye Fluo-4 (green) and examined for the time course of changes in the intracellular Ca2+ levels before and after addition of the OVA peptide in the presence of OT-I T cells (left). Time course of the normalized maximal fluorescence intensities before and after addition of the OVA peptide (right). During addition of the antigenic peptide, target cells displayed either short transient Ca2+ oscillations (E) (supplemental Movie 4, available at www.jneurosci.org as supplemental material) or persistent increases of the intracellular Ca2+ levels (F) (supplemental Movie 5, available at www.jneurosci.org as supplemental material). G, Bar graph representation of the density of visually detected PI-positive neurons (DCA) in chronic hippocampal slice cultures after 24 h under control conditions (ctrl, 42 ± 5 DCA; n = 57), after application of OT-I cells without peptide (OT-I, 109 ± 19 DCA; n = 36), and after application of OT-I cells in the presence of OVA peptide (25 nm OVA; OT-I + OVA, 193 ± 30 DCA; n = 10). Data are presented as mean ± SEM. *p < 0.05; ***p < 0.01.

Similar articles

Cited by

References

    1. Bauer J, Bien CG, Lassmann H. Rasmussen's encephalitis: a role for autoimmune cytotoxic T lymphocytes. Curr Opin Neurol. 2002;15:197–200. - PubMed
    1. Binah O, Marom S, Rubinstein I, Robinson RB, Berke G, Hoffman BF. Immunological rejection of heart transplant: how lytic granules from cytotoxic T lymphocytes damage guinea pig ventricular myocytes. Pflugers Arch. 1992;420:172–179. - PubMed
    1. Brunner T, Mogil RJ, LaFace D, Yoo NJ, Mahboubi A, Echeverri F, Martin SJ, Force WR, Lynch DH, Ware CF, Green DR. Cell-autonomous Fas (CD95)/Fas-ligand interaction mediates activation-induced apoptosis in T-cell hybridomas. Nature. 1995;373:441–444. - PubMed
    1. Choi C, Benveniste EN. Fas ligand/Fas system in the brain: regulator of immune and apoptotic responses. Brain Res Brain Res Rev. 2004;44:65–81. - PubMed
    1. Denecker G, Vercammen D, Declercq W, Vandenabeele P. Apoptotic and necrotic cell death induced by death domain receptors. Cell Mol Life Sci. 2001a;58:356–370. - PMC - PubMed

Publication types

MeSH terms