. 2009 Dec 9;29(49):15564-74.
doi: 10.1523/JNEUROSCI.3065-09.2009.

Temporal envelope of time-compressed speech represented in the human auditory cortex

Affiliations

Temporal envelope of time-compressed speech represented in the human auditory cortex

Kirill V Nourski et al. J Neurosci. .

Abstract

Speech comprehension relies on temporal cues contained in the speech envelope, and the auditory cortex has been implicated as playing a critical role in encoding this temporal information. We investigated auditory cortical responses to speech stimuli in subjects undergoing invasive electrophysiological monitoring for pharmacologically refractory epilepsy. Recordings were made from multicontact electrodes implanted in Heschl's gyrus (HG). Speech sentences, time compressed from 0.75 to 0.20 of natural speaking rate, elicited average evoked potentials (AEPs) and increases in event-related band power (ERBP) of cortical high-frequency (70-250 Hz) activity. Cortex of posteromedial HG, the presumed core of human auditory cortex, represented the envelope of speech stimuli in the AEP and ERBP. Envelope following in ERBP, but not in AEP, was evident in both language-dominant and -nondominant hemispheres for relatively high degrees of compression where speech was not comprehensible. Compared to posteromedial HG, responses from anterolateral HG-an auditory belt field-exhibited longer latencies, lower amplitudes, and little or no time locking to the speech envelope. The ability of the core auditory cortex to follow the temporal speech envelope over a wide range of speaking rates leads us to conclude that such capacity in itself is not a limiting factor for speech comprehension.


Figures

Figure 1.
Figure 1.
Temporal envelopes (top row) and spectrograms (middle and bottom row) of time-compressed stimuli (speech sentence “Black cars cannot park”) used in the experiments. In the bottom row, spectrograms of stimuli compressed to ratios of 0.75 (least compressed) and 0.20 (most compressed) are replotted to illustrate preservation of spectral content across compression ratios.
Figure 2.
Figure 2.
Comprehension of time-compressed speech sentences by the neurosurgical subject patients (symbols) and in a control group of healthy subjects (n = 20) (mean ± SD; lines with error bars). The subjects' performance in the psychophysical task was measured as the comprehension index (see Materials and Methods for details). Dashed line indicates chance level.
Figure 3.
Figure 3.
AEPs recorded from left HG in a representative subject. A, MRI surface rendering of the superior temporal plane showing location of the micro recording contacts. Macrocontacts used for recording of clinical data are not shown. Insets, Tracings of MRI cross sections showing the location of the recording contacts (open circles) within the gray matter at three representative locations. Dark gray shading denotes the estimated extent of the HG. B, AEP waveforms across compression ratios (left to right: moderate to severe compression) and the length of HG (top to bottom: posteromedial to anterolateral). Temporal envelopes of the speech stimuli are shown in the top panels. Recordings from contacts 13 and 14, which were located outside HG gray matter, are not shown. Negative voltage is plotted upward. HG, Heschl's gyrus (anterior transverse gyrus); TG2: second transverse gyrus; PP, planum polare; PT, planum temporale; ats, anterior transverse sulcus; is, intermediate sulcus; hs, Heschl's sulcus.
Figure 4.
Figure 4.
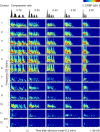
ERBP analysis of recordings from left HG (same subject as in Fig. 3) across compression ratios (left to right: moderate to severe compression) and the length of HG (top to bottom: posteromedial to anterolateral). Temporal envelopes of the speech stimuli are shown in the top panels. Recordings from contacts 13 and 14, which were located outside HG gray matter, are not shown. ERBP was measured in dB relative to power in a reference period of 0.2–0.1 s before stimulus onset. Vertical lines indicate the frequency band (70–250 Hz) in which ERBP envelopes were calculated.
Figure 5.
Figure 5.
AEPs recorded from right HG in a representative subject. See legend of Figure 3 for details.
Figure 6.
Figure 6.
ERBP analysis of recordings from right HG (same subject as in Fig. 5). See legend of Figure 4 for details. Recordings from contacts 6, 7, and 13 were contaminated with power line noise (60 Hz) and are not shown.
Figure 7.
Figure 7.
Responses to time-compressed speech sentences recorded from core auditory cortex in six subjects (top to bottom) across compression ratios (left to right: moderate to severe compression). AEPs and ERBP envelopes are plotted in blue and red, respectively. Temporal envelopes of the speech stimuli are shown in the top panels.
Figure 8.
Figure 8.
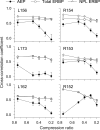
Peak values of cross-correlograms between speech envelopes and AEPs (filled circles), total ERBP envelopes (open squares), and NPL ERBP envelopes (open triangles). Data from six subjects; same contacts as in Figure 5. Error bars indicate 95% confidence intervals.
Figure 9.
Figure 9.
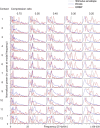
Power spectra of the stimulus envelopes (gray), response waveforms (blue) and ERBP envelopes (red). Data from same subject as in Figure 3 presented across compression ratios (left to right: moderate to severe compression) and the length of HG (top to bottom: posteromedial to anterolateral).
Figure 10.
Figure 10.
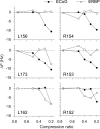
Stimulus–response frequency matching. Filled circles represent frequency difference between the modal frequencies of the stimulus envelope and local maxima of the averaged spectra of ECoG. Open squares represent frequency difference between modal frequencies of the stimulus envelope and local maxima of ERBP spectra. Data from six subjects; same contacts as in Figures 5 and 6.
Figure 11.
Figure 11.
Correlation between envelope following of core auditory cortical responses and speech comprehension. A, Peak values of cross-correlograms between speech envelopes and cortical responses (filled circles, AEPs; open squares, ERBP envelopes) are plotted against comprehension index values. B, Differences between the modal frequencies of the stimulus envelope and local maxima of the cortical response spectra (filled circles, ECoG; open squares, ERBP envelopes) are plotted against comprehension index values. Lines indicate linear regression based on data from five subjects, in which the psychophysical experiment was performed (L156, L173, L162, R154, and R153).

Similar articles

Cited by

References

    1. Abrams DA, Nicol T, Zecker S, Kraus N. Right-hemisphere auditory cortex is dominant for coding syllable patterns in speech. J Neurosci. 2008;28:3958–3965. - PMC - PubMed
    1. Ahissar E, Ahissar M. Processing of the temporal envelope of speech. In: König R, Heil P, Budinger E, Scheich H, editors. The auditory cortex: a synthesis of human and animal research. Mahwah, NJ: Erlbaum; 2005. pp. 295–314.
    1. Ahissar E, Nagarajan S, Ahissar M, Protopapas A, Mahncke H, Merzenich MM. Speech comprehension is correlated with temporal response patterns recorded from auditory cortex. Proc Natl Acad Sci U S A. 2001;98:13367–13372. - PMC - PubMed
    1. Barth DS, Di S. Three-dimensional analysis of auditory-evoked potentials in rat neocortex. J Neurophysiol. 1990;64:1527–1536. - PubMed
    1. Bendor D, Wang X. Differential neural coding of acoustic flutter within primate auditory cortex. Nat Neurosci. 2007;10:763–771. - PubMed

Publication types

LinkOut - more resources