. 2009 Dec 9;29(49):15586-94.
doi: 10.1523/JNEUROSCI.3793-09.2009.

Neuromodulation at single presynaptic boutons of cerebellar parallel fibers is determined by bouton size and basal action potential-evoked Ca transient amplitude

Affiliations

Neuromodulation at single presynaptic boutons of cerebellar parallel fibers is determined by bouton size and basal action potential-evoked Ca transient amplitude

Wei Zhang et al. J Neurosci. .

Abstract

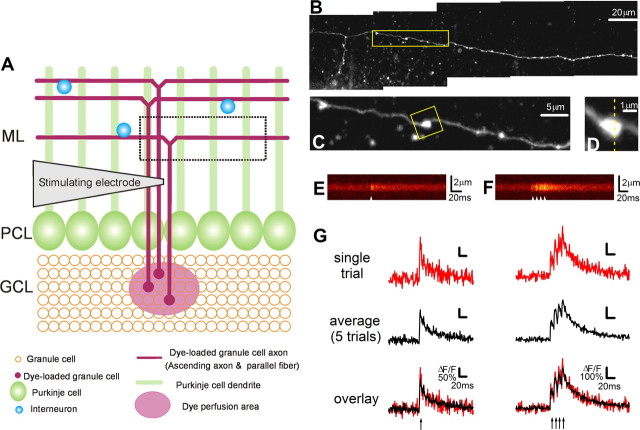
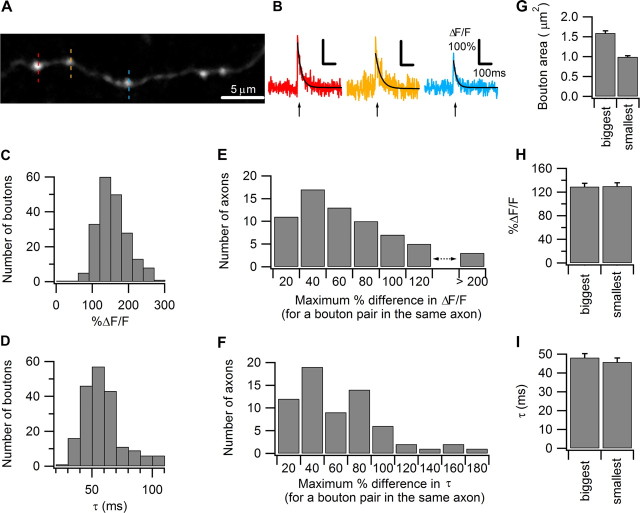
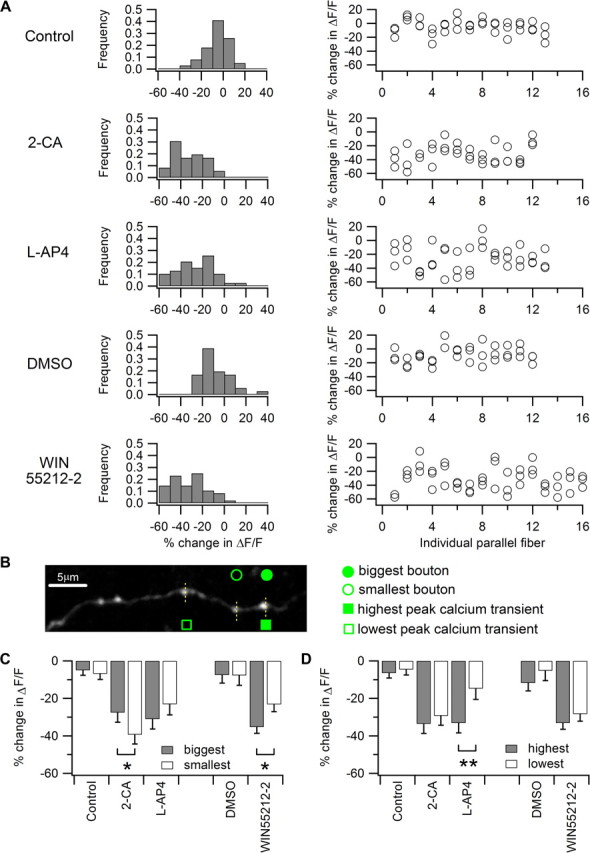
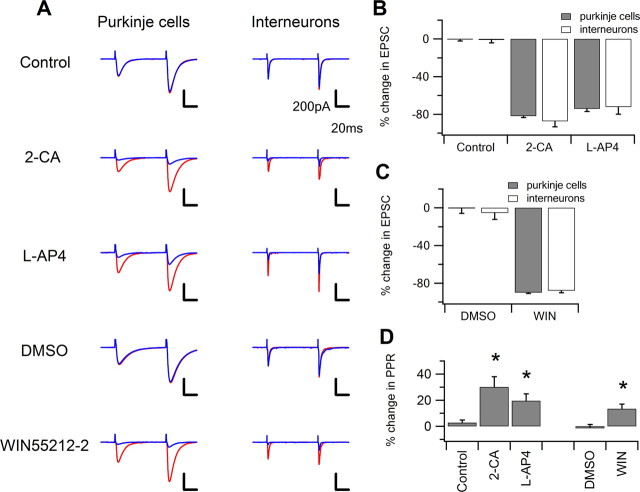
Most presynaptic terminals in the brain contain G-protein-coupled receptors that function to reduce action potential-evoked neurotransmitter release. These neuromodulatory receptors, including those for glutamate, GABA, endocannabinoids, and adenosine, exert a substantial portion of their effect by reducing evoked presynaptic Ca(2+) transients. Many axons form synapses with multiple postsynaptic neurons, but it is unclear whether presynaptic attenuation in these synapses is homogeneous, as suggested by population-level Ca(2+) imaging. We loaded Ca(2+)-sensitive dyes into cerebellar parallel fiber axons and imaged action potential-evoked Ca(2+) transients in individual presynaptic boutons with application of three different neuromodulators and found that adjacent boutons on the same axon showed striking heterogeneity in their strength of attenuation. Moreover, attenuation was predicted by bouton size or basal Ca(2+) response: smaller boutons were more sensitive to adenosine A1 agonist but less sensitive to CB1 agonist, while boutons with high basal action potential-evoked Ca(2+) transient amplitude were more sensitive to mGluR4 agonist. These results suggest that boutons within brief segment of a single parallel fiber axon can have different sensitivities toward neuromodulators and may have different capacities for both short-term and long-term plasticities.


Figures

Figure 1.
Figure 1.
Action potential-evoked Ca2+ transients measured at individual PF boutons using the sparse loading method. A, Schematic diagram of the experimental protocol. PFs were sparsely loaded with the dye solution, containing dextran-conjugated Alexa Fluor 594 and dextran-conjugated Fluo-4, by local perfusion at the granule cell layer (GCL). Action potentials were evoked using extracellular stimulation near the loaded axon, and Ca2+ transients were recorded at individual boutons. The box demarcated by the dashed line indicates the relative position of the fiber shown in B. PCL, Purkinje cell layer; ML, molecular layer. B, Maximal intensity projection confocal stack image showing a dye-loaded PF. C, Higher-magnification confocal image of the PF indicated in B (box). Individual boutons appear as bead-like varicosities along axons. D, High-magnification view of the single bouton from C (box). Ca2+ imaging was performed in line-scan mode as indicated. E, A representative Fluo-4 line-scan image of the Ca2+ transient evoked by a single stimulus (arrowhead) at the bouton in D. The corresponding Ca2+ transient trace is shown in G (top, left). F, A representative Fluo-4 line-scan image of the Ca2+ transient evoked by a burst stimulus (arrowheads) at the bouton in D. The corresponding Ca2+ transient trace is shown in G (top, right). The burst stimulus consisted of four pulses delivered at 100 Hz. G, Representative single- (left) or burst- (right) stimulation-evoked Ca2+ transients measured from the bouton in D were plotted as ΔF/F over time. Ca2+ transients from a representative single trial (top) and an average of five trials (middle) are shown in red and black, respectively, and their overlay is shown in the bottom panel.
Figure 2.
Figure 2.
PF boutons show heterogeneous action potential-evoked Ca2+ transients. A, Ca2+ imaging was performed sequentially on three individual boutons indicated by dotted lines in red, yellow, and blue. This confocal stack image was projected by summing pixel intensities. B, Action potential-evoked Ca2+ transients measured sequentially from 3 neighboring boutons on the same PF shown in A illustrate the variation in amplitude and decay time constant. The average traces from five trials are shown, and the Ca2+ responses were well fit by single-exponential decay curves, shown as superimposed black lines. The arrow indicates the onset of the single action potential. C, Histogram of the single action potential-evoked Ca2+ response amplitudes from 198 PF boutons. D, Histogram of the single action potential-evoked Ca2+ response decay time constant from 198 PF boutons. E, Histogram of the maximum percentage difference in single action potential-evoked Ca2+ response amplitudes comparing three boutons measured on the same axon from 66 axons. F, Histogram of the maximum percentage difference in single action potential-evoked Ca2+ response decay time constant comparing three boutons measured on the same axon from 66 axons. G, Bar graph showing average bouton areas of the biggest and smallest boutons on a single PF axon. Bouton areas were determined from the z-projection of confocal images of the dye-filled bouton obtained after calcium imaging. H, Bar graph showing the single action potential-evoked Ca2+ response amplitudes comparing the biggest bouton with the smallest bouton on the same axon, measured from 51 axons. Axons were only included if the biggest bouton was at least 60% larger in volume compared with the smallest bouton. Error bars indicate the SEM in this and all subsequent figures. I, Bar graph showing the single action potential-evoked Ca2+ response decay time constant comparing the biggest with the smallest boutons from 51 axons.
Figure 3.
Figure 3.
Neuromodulators' effects on AP-evoked Ca2+ transients at individual PF boutons are heterogeneous and correlated with bouton basal functionalstatus and morphology. A, AP-evoked Ca2+ responses at PF boutons were heterogeneously attenuated by neuromodulators. Three neuromodulator receptors were examined by application of exogenous agonists including 5 μm 2-CA, an adenosine A1 receptor agonist, 100 μm l-AP4, a mGluR4 agonist, and 5 μm WIN55212-2, a CB1 receptor agonist. The amplitudes of the AP-evoked Ca2+ transients in individual boutons were determined first in the absence and then in the presence of neuromodulator receptor agonists. The difference in Ca2+ transients was calculated as percentage change in ΔF/F compared to the control condition. Frequency histograms of the percentage change in ΔF/F of PF boutons from different experimental groups (control, n = 39; 2-CA, n = 36; l-AP4, n = 39; vehicle, n = 36; and WIN55212-2, n = 48) were plotted in the left panel. The same data, replotted to show boutons from individual PFs are shown in the right panel. B, A representative z-projection image of a PF used to examine neuromodulators' effects on AP-evoked Ca2+ transients is shown. Ca2+ imaging was performed in line-scan mode on the three boutons indicated by the dotted lines. The bouton with biggest volume among the three on the same fiber is indicated by the filled circle and the smallest is indicated by the open circle. The bouton with highest peak AP-evoked Ca2+ transient in the absence of the agonist is indicated by the filled square and the lowest is indicated by the open square. C, Summary graph showing that big boutons are more sensitive to WIN55212-2 (n = 10) and less sensitive to 2-CA (n = 10) compared to small boutons. However, big and small boutons exhibit no difference in Ca2+ transient attenuation in the l-AP4 (n = 9) and vehicle control groups (control, n = 12; DMSO-containing vehicle, n = 10). *p < 0.05. D, Summary graph showing that boutons with the highest basal Ca2+ transient are significantly more sensitive to l-AP4 (n = 12) than those with the lowest basal Ca2+ transient. This difference was not found in 2-CA (n = 10), WIN55212-2 (n = 16), and vehicle groups (control; n = 13; DMSO-containing vehicle, n = 11). **p < 0.01.
Figure 4.
Figure 4.
PF–Purkinje cell synapses and PF–interneuron synapses show similar attenuation by presynaptic neuromodulators. A, Evoked glutamatergic EPSCs at both PF–Purkinje cell (left column) and PF–interneuron (right column) synapses are attenuated by agonists of the following receptors: adenosine A1 receptor by 5 μm 2-CA, mGluR4 by 100 μm l-AP4, and CB1 by 5 μm WIN55212-2. Cells were clamped at −65 mV and EPSCs were evoked in the presence of 10 μm SR95531, a GABAA receptor antagonist by paired-pulse stimulation with an 80 ms interpulse interval. In the control condition (red), the evoked EPSCs show paired-pulse facilitation. After application of neuromodulator receptor agonists or their corresponding carrier solutions (blue), EPSCs were attenuated by 2-CA, l-AP4, and WIN55212-2, but not by control or DMSO-containing carrier solutions. The attenuation of EPSCs was also accompanied by an increase in the paired-pulse ratio. Traces shown are the average of 15 consecutive episodes. B, C, Summary graphs showing similar attenuation of PF–Purkinje cell and PF–interneuron EPSCs in response to application of 2-CA, l-AP4, and WIN55212-2 (n = 5 cells/group). D, Summary graph showing that at the PF–Purkinje cell synapse, 2-CA, l-AP4, and WIN55212-2 significantly increase PPR, suggesting that the attenuation of synaptic strength by the agonists is achieved, at least in part, through modification of presynaptic release probability. PPRs were not calculated for PF–interneuron synapses because the agonists produced intermittent failures of synaptic transmission.

Similar articles

Cited by

References

    1. Abitbol K, Acher F, Daniel H. Depression of excitatory transmission at PF-PC synapse by group III metabotropic glutamate receptors is provided exclusively by mGluR4 in the rodent cerebellar cortex. J Neurochem. 2008;105:2069–2079. - PubMed
    1. Acsády L, Kamondi A, Sík A, Freund T, Buzsáki G. GABAergic cells are the major postsynaptic targets of mossy fibers in the rat hippocampus. J Neurosci. 1998;18:3386–3403. - PMC - PubMed
    1. Arenz A, Silver RA, Schaefer AT, Margrie TW. The contribution of single synapses to sensory representation in vivo. Science. 2008;321:977–980. - PMC - PubMed
    1. Bailey CH, Chen M. Morphological basis of long-term habituation and sensitization in Aplysia. Science. 1983;220:91–93. - PubMed
    1. Batchelor AM, Garthwaite J. GABAB receptors in the parallel fibre pathway of rat cerebellum. Eur J Neurosci. 1992;4:1059–1064. - PubMed

Publication types

MeSH terms

Substances

LinkOut - more resources