. 2009 Dec 9;29(49):15595-600.
doi: 10.1523/JNEUROSCI.3864-09.2009.

Neuronal avalanches imply maximum dynamic range in cortical networks at criticality

Affiliations

Neuronal avalanches imply maximum dynamic range in cortical networks at criticality

Woodrow L Shew et al. J Neurosci. .

Abstract

Spontaneous neuronal activity is a ubiquitous feature of cortex. Its spatiotemporal organization reflects past input and modulates future network output. Here we study whether a particular type of spontaneous activity is generated by a network that is optimized for input processing. Neuronal avalanches are a type of spontaneous activity observed in superficial cortical layers in vitro and in vivo with statistical properties expected from a network operating at "criticality." Theory predicts that criticality and, therefore, neuronal avalanches are optimal for input processing, but until now, this has not been tested in experiments. Here, we use cortex slice cultures grown on planar microelectrode arrays to demonstrate that cortical networks that generate neuronal avalanches benefit from a maximized dynamic range, i.e., the ability to respond to the greatest range of stimuli. By changing the ratio of excitation and inhibition in the cultures, we derive a network tuning curve for stimulus processing as a function of distance from criticality in agreement with predictions from our simulations. Our findings suggest that in the cortex, (1) balanced excitation and inhibition establishes criticality, which maximizes the range of inputs that can be processed, and (2) spontaneous activity and input processing are unified in the context of critical phenomena.


Figures
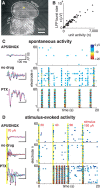
Figure 1.
Figure 1.
Measuring spontaneous and stimulus-evoked activity from cortical networks. A, Light-microscopic image of a somatosensory cortex and dopaminergic midbrain region (VTA) coronal slice cultured on a 60-channel microelectrode array. Yellow dot, Stimulation site. Black dots, Recording sites. B, Number of extracellular spikes correlates with the size of simultaneously recorded nLFP burst (R = 0.84 ± 0.13; n = 1). Each point represents total number of spikes versus the corresponding spontaneous nLFP burst size. C, Example recordings of spontaneous LFP fluctuations (left) and nLFP rasters (right) for three drug conditions (top, AP5/DNQX; middle, no drug; bottom, PTX). D, Examples of LFP evoked by 70 μA stimulus (left) and rasters recorded during the application of four stimuli of amplitudes 50, 40, 90, 150 μA (yellow line, stimulus time) (right) for three drug conditions. For both spontaneous (C) and stimulus-evoked (D) activity AP5/DNQX (PTX) typically results in reduced (increased) amplitude LFP events with lesser (greater) spatial extent. In C and D, black dots on the LFP traces indicate nLFP events, raster point color indicates nLFP amplitude, and all calibration bars (left) represent 50 μV, 100 ms.
Figure 2.
Figure 2.
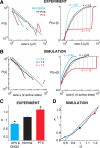
Change in the ratio of excitation/inhibition moves cortical networks away from criticality. A, Left, PDFs of spontaneous cluster sizes for normal (no-drug, black), disinhibited (PTX, red), and hypoexcitable (AP5/DNQX, blue) cultures. Broken line, −3/2 power law. Cluster size s is the sum of nLFP peak amplitudes within the cluster; P(s) is the probability of observing a cluster of size s. Right, Corresponding CDFs and quantification of the network state using κ, which measures deviation from a −1/2 power law CDF (broken line). Vertical gray lines, The 10 distances summed to compute κ, shown for one example PTX condition (red). B, Simulated cluster size PDFs (left) and corresponding CDFs (right) for different values of the model control parameter σ. C, Summary statistics of average κ values for normal, hypoexcitable, and disinhibited conditions (*p < 0.05 from normal). D, In simulations, κ accurately estimates σ. Broken line, κ = σ. Colored dots, Examples shown in B.
Figure 3.
Figure 3.
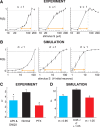
Stimulus–response curves and dynamic range Δ. A, Experimental response R evoked by current stimulation of amplitude S for three example cultures with different κ values. Orange arrows, Range from Smin to Smax; length is proportional to Δ. Note that Δ is largest for κ ≅ 1. B, Model response evoked by different numbers of initially activated sites; Δ is largest for σ ≅ 1. Like the experiment, each point is calculated from 40 stimuli. Error bars, 1 SE. C, Experimental summary statistics for κ under different pharmacological conditions (*p < 0.05 from normal). D, Simulation summary statistics for κ comparing different ranges of σ (*p < 0.05 from σ ≅ 1).
Figure 4.
Figure 4.
Network tuning curve for dynamic range Δ near criticality. A, In experiments, Δ peaks close to κ ≅ 1 and drops rapidly with distance from criticality. Paired measurements share the same symbol shape; normal (no-drug) condition was measured just before the drug condition. Circles, Unpaired measurement. B, In simulations, Δ is also maximum for κ ≅ 1. Symbol indicates network size (circles, N = 250; squares, N = 500; triangles, N = 1000). Lines represent binned averages.

References

    1. Arieli A, Sterkin A, Grinvald A, Aertsen A. Dynamics of ongoing activity: explanation of the large variability in evoked cortical responses. Science. 1996;273:1868–1871. - PubMed
    1. Azouz R, Gray CM. Cellular mechanisms contributing to response variability of cortical neurons in vivo. J Neurosci. 1999;19:2209–2223. - PMC - PubMed
    1. Bak P, Paczuski M. Complexity, contingency, and criticality. Proc Natl Acad Sci U S A. 1995;92:6689–6696. - PMC - PubMed
    1. Beggs JM, Plenz D. Neuronal avalanches in neocortical circuits. J Neurosci. 2003;23:11167–11177. - PMC - PubMed
    1. Bertschinger N, Natschläger T. Real-time computation at the edge of chaos in recurrent neural networks. Neural Comput. 2004;16:1413–1436. - PubMed

Publication types

LinkOut - more resources