. 2010 Feb;103(2):844-57.
doi: 10.1152/jn.00825.2009. Epub 2009 Dec 9.

Merging of healthy motor modules predicts reduced locomotor performance and muscle coordination complexity post-stroke

Affiliations

Merging of healthy motor modules predicts reduced locomotor performance and muscle coordination complexity post-stroke

David J Clark et al. J Neurophysiol. 2010 Feb.

Abstract

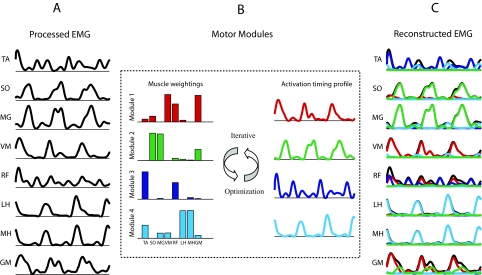
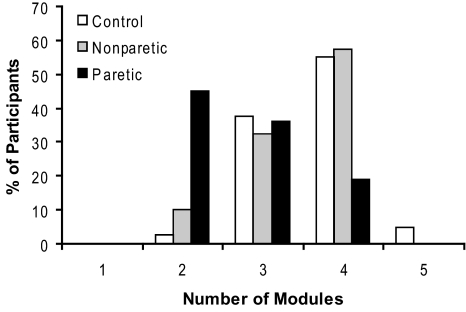
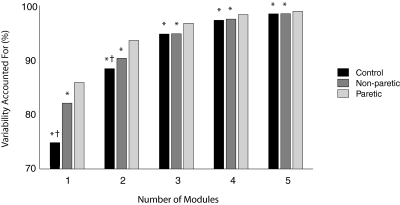
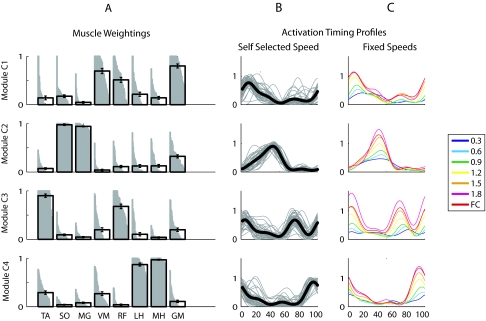
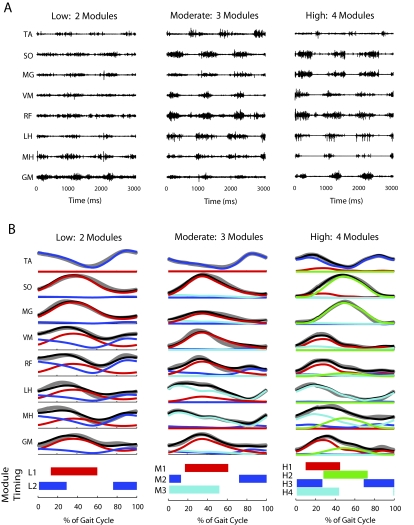
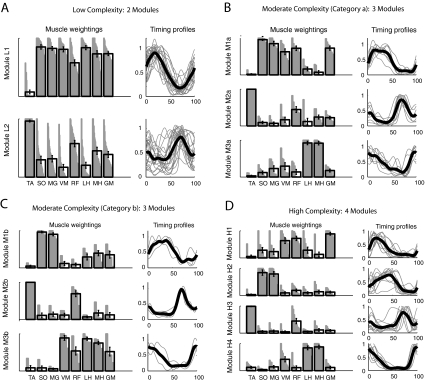
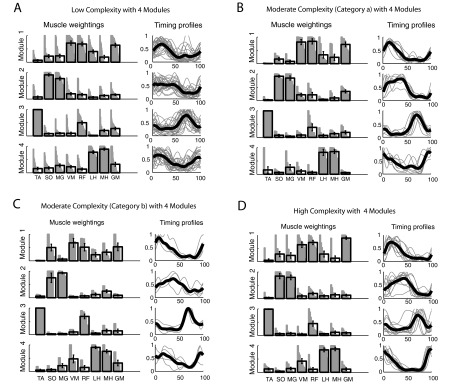
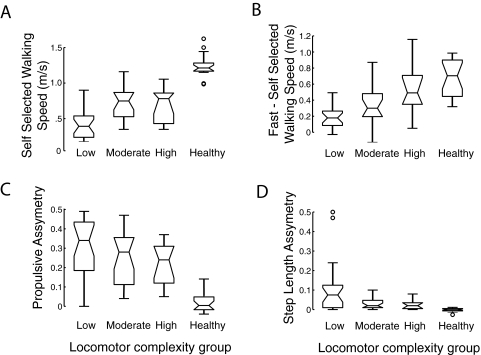
Evidence suggests that the nervous system controls motor tasks using a low-dimensional modular organization of muscle activation. However, it is not clear if such an organization applies to coordination of human walking, nor how nervous system injury may alter the organization of motor modules and their biomechanical outputs. We first tested the hypothesis that muscle activation patterns during walking are produced through the variable activation of a small set of motor modules. In 20 healthy control subjects, EMG signals from eight leg muscles were measured across a range of walking speeds. Four motor modules identified through nonnegative matrix factorization were sufficient to account for variability of muscle activation from step to step and across speeds. Next, consistent with the clinical notion of abnormal limb flexion-extension synergies post-stroke, we tested the hypothesis that subjects with post-stroke hemiparesis would have altered motor modules, leading to impaired walking performance. In post-stroke subjects (n = 55), a less complex coordination pattern was shown. Fewer modules were needed to account for muscle activation during walking at preferred speed compared with controls. Fewer modules resulted from merging of the modules observed in healthy controls, suggesting reduced independence of neural control signals. The number of modules was correlated to preferred walking speed, speed modulation, step length asymmetry, and propulsive asymmetry. Our results suggest a common modular organization of muscle coordination underlying walking in both healthy and post-stroke subjects. Identification of motor modules may lead to new insight into impaired locomotor coordination and the underlying neural systems.


Figures

Fig. 1.
Fig. 1.
Reconstruction of EMGs by nonnegative matrix factorization (NNMF). Only 3 consecutive cycles of reconstruction are shown. A: normalized muscle activation signals from eight unilateral leg muscles over a series of cycles were analyzed. B: muscle activity was processed by an NNMF algorithm, which applied an iterative optimization procedure to best reconstruct the activation signals using a small set of motor modules. For each module, the adjusted parameters include muscle weightings and an activation timing profile across the gait cycle. The contribution of any given module to a muscle's activation over the gait cycle is the product of the muscle weighting for that module times the module's activation timing profile. C: for each muscle, the summed contributions from the modules constitute the reconstructed EMG signal.
Fig. 2.
Fig. 2.
Number of modules at self-selected walking speed. Four modules were needed to account for cycle-by-cycle variability of muscle activity recorded from 8 unilateral leg muscles during self-selected walking in the majority of healthy control and nonparetic legs. Significantly fewer modules were required for the paretic legs.
Fig. 3.
Fig. 3.
Total variability accounted for based on the number of modules extracted by NNMF. For each number of modules, the control and nonparetic legs had lower variability accounted for (VAF) than the paretic leg (*P < .001), and with 1 or 2 modules, the control legs had lower VAF than the nonparetic legs (†P < .001). Lower VAF for a particular number of modules indicates that the analysis is less able to account for the overall variability because of greater complexity in the muscle activation patterns during walking.
Fig. 4.
Fig. 4.
Module muscle weightings and activation timing profiles for each of the modules C1–C4 in healthy individuals (n = 40 legs) at self-selected walking speed and individual activation timing profiles with walking speed. A: for each module C1–C4, muscle weightings indicate the strength of representation for each muscle. Gray bars show the representation of that muscle within the module (all left and right healthy legs are shown). If a muscle was fully represented within a module across all subjects, the gray region would form a perfect rectangle. The black bar for each muscle weighting indicates group mean and SE. B: timing profiles indicate how activation of a module varies over the gait cycle. Thin gray lines show the profiles for each individual leg, with each line representing the average of the leg over all the gait cycles. Thick black lines show the group mean. C: group mean activation timing profiles of modules C1–C4 at various fixed speeds ranging from 0.3 to 1.8 m/s and at the fastest comfortable speed (FC). The muscle weightings shown in A were constrained to be identical for the EMG reconstruction performed at each of the walking speeds.
Fig. 5.
Fig. 5.
Comparison of muscle activity and module timing in paretic legs with low, moderate, and high locomotor output complexity. A: unprocessed muscle activity from 3 s of walking in individual subjects with low (2 modules), moderate (3 modules), and high (4 modules) locomotor output complexity. B: processed muscle activity (gray lines), reconstructed muscle activity (black lines), and the contribution from each module to the reconstructed activity (colored lines) for each muscle averaged over 10 consecutive gait cycles. In both A and B, note that the activation patterns appear broader and less differentiated in the low complexity subject. The horizontal bars at the bottom of the figure indicate where in the gait cycle each module is highly active (defined as >50% of the mean activity).
Fig. 6.
Fig. 6.
Module muscle weightings and activation timing profiles in the paretic leg of persons post-stroke at self-selected walking speed. Refer to Fig. 4 for meaning of gray and black bars and lines. A: the low complexity subgroup had a stance module (L1) that resembled a combination of control modules C1, C2, and C4 and a swing module (L2) that resembled control module C3. B: 1 of the moderate complexity subgroups (category a) had a stance module (M1a) that resembled a combination of control modules C1 and C2 and a swing module (M2a) that resembled control module C3. The 3rd module (M3a) resembled control module C4. C: the 2nd moderate complexity subgroup (category b) had a stance module (M1b) that resembled control module C2 and a swing module (M2b) that resembled control module C3. The 3rd module (M3b) resembled a combination of control modules C1 and C4. D: the high complexity subgroup had 4 modules (H1–H4) that resembled control modules C1–C4, respectively.
Fig. 7.
Fig. 7.
Module muscle weightings and activation timing profiles identified when NNMF was performed using 4 modules in all paretic legs. Refer to Fig. 4 for meaning of gray and black bars and lines. Associations within each group for muscle weightings and activation timing profiles are quantified in Table 2, C and D, respectively. A: the low complexity subgroup had modules with independent composition (muscle weightings) but similar timing of modules 1, 2, and 4. B: the category a moderate complexity subgroup had modules with independent composition but similar timing of modules 1 and 2. C: the category b moderate complexity subgroup had modules with independent composition but similar timing of modules 1 and 4. D: the high complexity subgroup had modules with independent composition and activation timing profiles that were less correlated than in the moderate and low complexity subgroups.
Fig. 8.
Fig. 8.
Locomotor output complexity and walking performance. Locomotor output complexity in the paretic leg of persons post-stroke is associated with measures of walking performance, including (A) overground self-selected walking speed, (B) speed difference between self-selected and fast walking, (C) propulsive asymmetry, and (D) step length asymmetry. In C and D, 0 represents perfect symmetry, whereas higher values indicate asymmetry. Healthy control data are shown as a reference but were not included in the statistical analysis. The 3 horizontal bars representing each variable indicate, from bottom to top, the lower quartile, median, and upper quartile. Error bars indicate ±1.5 · interquartile range. Circles represent outlying data points.

Similar articles

Cited by

References

    1. Balasubramanian CK, Bowden MG, Neptune RR, Kautz SA. Relationship between step length asymmetry and walking performance in subjects with chronic hemiparesis. Arch Phys Med Rehabil 88: 43–49, 2007 - PubMed
    1. Berniker M, Jarc A, Bizzi E, Tresch MC. Simplified and effective motor control based on muscle synergies to exploit musculoskeletal dynamics. Proc Natl Acad Sci USA 106: 7601–7606, 2009 - PMC - PubMed
    1. Bernstein NA. The Coordination and Regulation of Movements Oxford, UK: Pergamon Press, 1967
    1. Bizzi E, Cheung VC, d'Avella A, Saltiel P, Tresch M. Combining modules for movement. Brain Res Rev 57: 125–133, 2008 - PMC - PubMed
    1. Bowden MG, Balasubramanian CK, Neptune RR, Kautz SA. Anterior-posterior ground reaction forces as a measure of paretic leg contribution in hemiparetic walking. Stroke 37: 872–876, 2006 - PubMed

Publication types

MeSH terms