. 2010 Apr;24(4):1239-48.
doi: 10.1096/fj.09-147074. Epub 2009 Dec 9.

A novel human heparanase splice variant, T5, endowed with protumorigenic characteristics

Affiliations

A novel human heparanase splice variant, T5, endowed with protumorigenic characteristics

Uri Barash et al. FASEB J. 2010 Apr.

Abstract

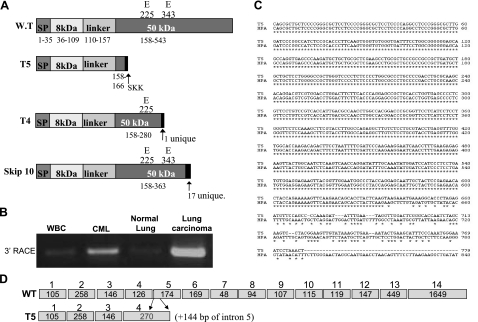
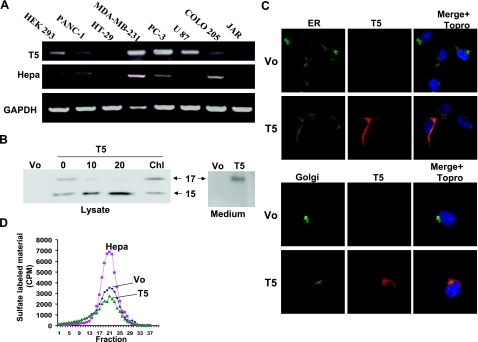
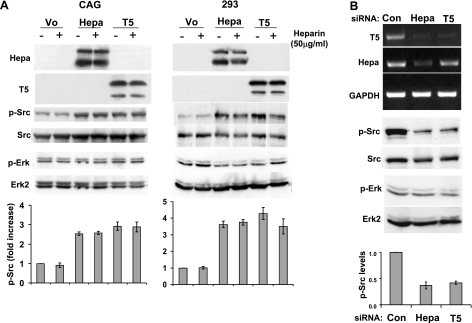
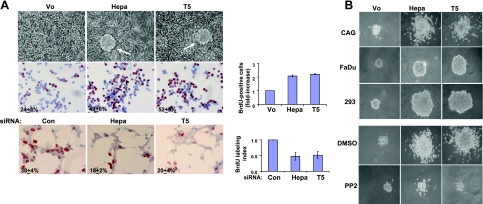
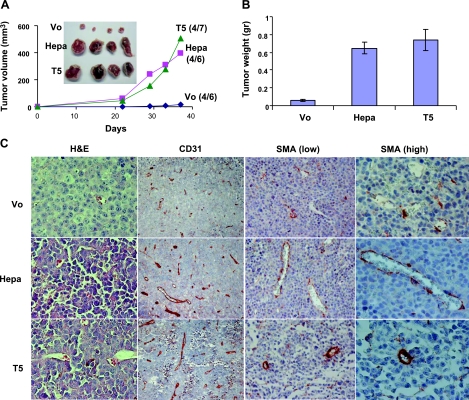
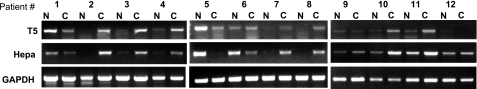
Heparanase is a mammalian endo-beta-d-glucuronidase that can cleave heparan sulfate side chains, an activity strongly implicated in tumor cell dissemination. The current study aimed to identify and characterize heparanase splice variants. LEADS, Compugen's alternative splicing modeling platform (Compugen, Tel Aviv, Israel), was used to search for splice variants in silico; tumor-derived cell lines (i.e., CAG myeloma) and tumor biopsies were utilized to validate T5 expression in vivo; signaling (i.e., Src phosphorylation) was evaluated following T5 gene silencing or overexpression and correlated with cell proliferation, colony formation, and tumor xenograft development. A novel spliced form of human heparanase, termed T5, was identified. In this splice variant, 144 bp of intron 5 are joined with exon 4, which results in a truncated, enzymatically inactive protein. T5 overexpression resulted in increased cell proliferation and larger colonies in soft agar, mediated by Src activation. Furthermore, T5 overexpression markedly enhanced tumor xenograft development. T5 expression is up-regulated in 75% of human renal cell carcinoma biopsies examined, which suggests that this splice variant is clinically relevant. Controls included cells overexpressing wild-type heparanase or an empty plasmid and normal-looking tissue adjacent the carcinoma lesion. T5 is a novel functional splice variant of human heparanase endowed with protumorigenic characteristics.-Barash, U., Cohen-Kaplan, V., Arvatz, G., Gingis-Velitski, S., Levy-Adam, F., Nativ, O., Shemesh, R., Ayalon-Sofer, M., Ilan, N., Vlodavsky, I. A novel human heparanase splice variant, T5, endowed with protumorigenic characteristics.


Figures

Figure 1.
Figure 1.
Expression of T5 splice variant. A) Schematic structure of heparanase splice variants emerging from Compugen’s LEADS search. B) 3′-RACE analysis of RNA extracted from white blood cells collected from healthy donor (WBC), patient with chronic myeloid leukemia (CML), lung carcinoma, and adjacent normal lung tissue. C) Sequence alignment indicating that the 3′-RACE product corresponds to the predicted T5 splice variant sequence. D) Schematic presentation of heparanase (WT) and T5 exon composition.
Figure 2.
Figure 2.
Cloning and expression of T5. A) RT-PCR analysis. Total RNA was extracted from the indicated cell line and subjected to RT-PCR analysis applying T5 (top panel), heparanase (middle panel), and GAPDH (bottom panel) specific primers, specified in the Materials and Methods section. B) T5 transfection. T5 was cloned into mammalian expression vector (pcDNA3), and transfected HEK 293 cells were left untreated (0) or incubated with tunicamycin (10, 20 μg/ml) or chloroquine (Chl; 100 μM). Control cells were transfected with an empty vector (Vo). Cell lysates (left panel) and cell conditioned medium (right panel) were blotted with anti-heparanase 1453 antibody. C) Cellular localization. Stably transfected HEK 293 cells were triple stained for Myc-tag (T5; red), the ER marker calnexin (ER; top panels, green), and merged with cell nuclei labeled with TO-PRO (top panels, blue). Cells were similarly stained with anti-Myc-tag (T5; red), the Golgi marker wheat germ agglutinin-FITC (Golgi; bottom panels, green) and merged with cell nuclei labeled with TO-PRO (bottom panels, blue). Shown is one image in which the two colors are of equal intensities, representative of many images, all exhibiting similar localization patterns. D) Enzymatic activity. HEK 293 cells transfected with heparanase (Hepa), T5, or control empty vector (Vo) were subjected to 3 freeze-thaw cycles and applied onto culture dishes coated with 35S-labeled ECM. Release of sulfate-labeled material eluted in fractions 15–30 was evaluated as measure of heparanase activity, as described in Materials and Methods.
Figure 3.
Figure 3.
T5 augments Src phosphorylation. A) Overexpression. CAG myeloma (left) and 293 (right) cells infected with heparanase (Hepa), T5, or control empty vector (Vo) were grown in the absence (–) or presence (+) of heparin (50 μg/ml) under serum-free conditions. Total cell lysates were subjected to immunoblotting, applying anti-heparanase 1453 (top and second panels), anti-phospho-Src (p-Src, third panels), anti-Src (fourth panels) anti-phospho-Erk (p-Erk, fifth panels), and anti-Erk2 antibodies (sixth panels). Bottom panels: Src phosphorylation index was calculated by densitometry analysis of phosphorylated Src levels divided by total Src values. Data are presented as average ± se fold increase of Src phosphorylation vs. control Vo cells (set to arbitrary value of 1) of 5 independent experiments. B) Gene silencing. Parental 293 cells were transfected with anti-heparanase, anti-T5, or control siRNAs. Total RNA was extracted, and RT-PCR analysis was performed, applying T5 (top panel), heparanase (Hepa; second panel), and GAPDH (third panel) specific primers. Corresponding cell lysates were subjected to immunoblotting, applying phospho-Src (p-Src; fourth panel), Src (fifth panel), phospho-Erk (p-Erk; sixth panel) and Erk2 (seventh panel) antibodies. Bottom panel: Src phosphorylation index, calculated as in A. Note decreased Src phosphorylation levels in response to T5 down-regulation.
Figure 4.
Figure 4.
T5 augments cell proliferation. A) BrdU incorporation. Top panel: morphology of control (Vo)-, heparanase (Hepa)-, and T5-infected CAG myeloma cell cultures. Middle panel: direct evaluation of DNA synthesis is demonstrated by BrdU incorporation. Subconfluent cultures of Vo-, Hepa-, and T5-infected CAG cells were grown in serum-free medium for 20 h, followed by incubation with BrdU (1:1000) for 2 h. Cells were then fixed and immunostained with anti-BrdU monoclonal antibody. Positively stained, red-brown nuclei were counted vs. blue, hematoxilin counterstained nuclei. At least 1000 cells were counted for each cell type; percentage of positively stained cells is noted in each panel. Fold increase in BrdU incorporation is shown graphically at right. Bottom panel: gene silencing. HEK 293 cells were transfected with anti-GFP (si-GFP), anti-heparanase (si-Hepa), or anti-T5 siRNA oligonucleotides, and BrdU incorporation was evaluated as above, except that cells were kept in serum-containing medium. Note 2-fold decrease in BrdU incorporation following heparanase or T5 gene silencing (right panel). B) Colony formation in soft agar. Vo-, Hepa-, and T5-infected CAG (top panel), Fadu (second panel) and 293 (third panel) cells (5×10³ cells/dish) were mixed with soft agar and cultured for 3–5 wk. CAG cells were similarly grown in the absence (DMSO; fourth panels) or presence of Src inhibitor (PP2, 0.4 nM; bottom panels). Photomicrographs of colonies are representative (×100 view).
Figure 5.
Figure 5.
T5 enhances tumor xenograft development. A, B) Control (Vo)-, heparanase-, and T5-infected CAG myeloma cells were injected subcutaneously (1×10⁶/ 0.1 ml) and tumor volume was calculated (A). At the end of the experiment on d 37, tumors were resected, photographed (A, inset) and weighed (B). C) Immunohistochemical analysis. Paraffin-embedded 5-μm sections were stained with hematoxilin and eosin (H&E; left column), anti-CD31 (left center column), and anti-smooth muscle actin antibodies (SMA; right center and right columns) antibodies. Note increased blood vessel density and maturation (recruitment of SMA-positive cells) in xenografts produced by heparanase- and T5-infected cells.
Figure 6.
Figure 6.
Clinical relevance of T5. Total RNA was extracted from biopsies of renal cell carcinoma (C) and adjacent normal looking tissue (N) and subjected to RT-PCR analysis applying T5 (top panel), heparanase (middle panel), and GAPDH primers (bottom panel).

References

    1. Nakajima M, Irimura T, DiFerrante D, DiFerrante N, Nicolson G L. Heparan sulfate degradation: relation to tumor invasion and metastatic properties of mouse B 16 melanoma sublines. Science. 1983;220:611–613. - PubMed
    1. Vlodavsky I, Fuks Z, Bar-Ner M, Ariav Y, Schirrmacher V. Lymphoma cells mediated degradation of sulfated proteoglycans in the subendothelial extracellular matrix: relation to tumor cell metastasis. Cancer Res. 1983;43:2704–2711. - PubMed
    1. Edovitsky E, Elkin M, Zcharia E, Peretz T, Vlodavsky I. Heparanase gene silencing, tumor invasiveness, angiogenesis, and metastasis. J Natl Cancer Inst. 2004;96:1219–1230. - PubMed
    1. Casu B, Vlodavsky I, Sanderson R D. Non-anticoagulant heparins and inhibition of cancer. Pathophysiol Haemost Thromb. 2008;36:195–203. - PMC - PubMed
    1. Dempsey L A, Brunn G J, Platt J L. Heparanase, a potential regulator of cell-matrix interactions. Trends Biochem Sci. 2000;25:349–351. - PubMed

Publication types

MeSH terms

LinkOut - more resources