. 2010 Jan 15;184(2):796-806.
doi: 10.4049/jimmunol.0901748. Epub 2009 Dec 9.

IFN regulatory factor 5 is required for disease development in the FcgammaRIIB-/-Yaa and FcgammaRIIB-/- mouse models of systemic lupus erythematosus

Affiliations

IFN regulatory factor 5 is required for disease development in the FcgammaRIIB-/-Yaa and FcgammaRIIB-/- mouse models of systemic lupus erythematosus

Christophe Richez et al. J Immunol. .

Abstract

Polymorphisms in the transcription factor IFN regulatory factor 5 (IRF5) are strongly associated in human genetic studies with an increased risk of developing the autoimmune disease systemic lupus erythematosus. However, the biological role of IRF5 in lupus pathogenesis has not previously been tested in an animal model. In this study, we show that IRF5 is absolutely required for disease development in the FcgammaRIIB(-/-)Yaa and FcgammaRIIB(-/-) lupus models. In contrast to IRF5-sufficient FcgammaRIIB(-/-)Yaa mice, IRF5-deficient FcgammaRIIB(-/-)Yaa mice do not develop lupus manifestations and have a phenotype comparable to wild-type mice. Strikingly, full expression of IRF5 is required for the development of autoimmunity, as IRF5 heterozygotes had dramatically reduced disease. One effect of IRF5 is to induce the production of the type I IFN, IFN-alpha, a cytokine implicated in lupus pathogenesis. To address the mechanism by which IRF5 promotes disease, we evaluated FcgammaRIIB(-/-)Yaa mice lacking the type I IFN receptor subunit 1. Unlike the IRF5-deficient and IRF5-heterozygous FcgammaRIIB(-/-)Yaa mice, type I IFN receptor subunit 1-deficient FcgammaRIIB(-/-)Yaa mice maintained a substantial level of residual disease. Furthermore, in FcgammaRIIB(-/-) mice lacking Yaa, IRF5-deficiency also markedly reduced disease manifestations, indicating that the beneficial effects of IRF5 deficiency in FcgammaRIIB(-/-)Yaa mice are not due only to inhibition of the enhanced TLR7 signaling associated with the Yaa mutation. Overall, we demonstrate that IRF5 plays an essential role in lupus pathogenesis in murine models and that this is mediated through pathways beyond that of type I IFN production.


Figures
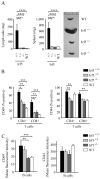
FIGURE 1
FIGURE 1
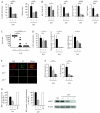
Lymphadenopathy, splenomegaly and lymphocyte activation is reduced in IRF5-deficient RII.Yaa mice. A, Lymph node and spleen weights from Irf5+/+ (n = 12), Irf5+/− (n = 12), and Irf5−/− (n=14) RII.Yaa mice and wildtype (WT) mice (n=12) were measured at 5 months of age. Representative spleens are shown in panel on right. B and C, CD69 and CD44 expression on splenic T cells (B) and B cells (C) from 5 month old Irf5+/+ (n = 6), Irf5+/− (n = 10), and Irf5−/− (n=9) RII.Yaa mice and wildtype (WT) mice (n=11). Data are presented as mean ± SEM. *, p < 0.05; **, p< 0.01; ***, p < 0.001; ****, p < 0.0001 by Mann-Whitney U test.
FIGURE 2
FIGURE 2
Decreased serum IgG and cytokine levels in IRF5-deficient RII.Yaa mice. A and B, Irf5+/+ (n = 12), Irf5+/− (n = 12), and Irf5−/− (n=14) RII.Yaa mice and wildtype (WT) mice (n=12) were analyzed at 5 months of age. A, Serum IgG isotype concentrations. B, Serum cytokine levels. C, IFIT1 and MX2 mRNA expression in kidneys of 4-5 month old Irf5+/+ (n = 5) and Irf5−/− (n=5) RII.Yaa mice shown as fold change relative to expression in kidneys of 4 month old C57BL/6 wildtype mice. Data are presented as mean ± SEM. *, p < 0.05; **, p< 0.01; ***, p < 0.001; ****, p < 0.0001 by Mann-Whitney U test.
FIGURE 3
FIGURE 3
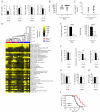
Decreased autoantibody production in IRF5-deficient RII.Yaa mice. Sera from Irf5+/+ (n = 11-12), Irf5+/− (n = 9-12), and Irf5−/− (n = 14) RII.Yaa mice were analyzed at 5 months of age. A, Anti-nuclear autoantibody (ANA) titers; ND, not detected. B, Anti-ribonucleoprotein (Sm/RNP) autoantibody levels. C, Anti-double-stranded DNA autoantibodies determined by kinetoplast staining intensity. Bars represent median values (B). **, p< 0.01; ***, p < 0.001; ****, p < 0.0001 by Mann-Whitney U test. D, Autoantigen array analysis was performed on sera from 5 month old Irf5+/+, Irf5+/− and Irf5−/− RII.Yaa mice and from wildtype (WT) mice. Samples are arranged by hierarchical clustering and displayed as a heat map. Significance Analysis of Microarrays (SAM) identified significant differences between Irf5+/+ lupus mice and the other experimental groups (q < 0.0001, false discovery rate = 0 for all 40 antigens shown). Antigens are ordered by the SAM observed score in descending order.
FIGURE 4
FIGURE 4
Decreased renal disease and enhanced survival in IRF5-deficient RII.Yaa mice. A and B, Irf5+/+ (n = 12), Irf5+/− (n = 12), and Irf5−/− (n=14) RII.Yaa mice and wildtype (WT) mice (n=12) were analyzed at 5 months of age. A, Representative renal histology. G indicates glomerulus. Arrows indicate cellular crescent. Arrowheads indicate necrotic areas within glomerulus. B, Quantitation of renal disease as shown by cell number per glomerulus, percentage of glomeruli with crescents, and interstitial disease score. C, Glomerular IgG and complement C3 deposition measured by fluorescence intensity (luminosity) in Irf5+/+ (n = 6), Irf5+/− (n = 3), Irf5−/− (n=6) RII.Yaa mice and WT mice (n = 4). D, Serum blood urea nitrogen (BUN) levels in Irf5+/+ (n = 10), Irf5+/− (n = 11), Irf5−/− (n=14) RII.Yaa mice and WT mice (n = 10). Data are presented as mean ± SEM. *, p < 0.05; **, p< 0.01; ***, p < 0.001; ****, p < 0.0001 by Mann-Whitney U test. E, Irf5+/+ (black line, n = 29), Irf5+/− (blue line, n = 22), and Irf5−/− (red line, n=38) RII.Yaa mice were observed until the time of death. ****, p < 0.0001, logrank test.
FIGURE 5
FIGURE 5
IRF5 deficiency reduces disease manifestations in RII mice lacking Yaa. A-F, All analyses were performed at 8 months of age. A, Lymph node and spleen weights from Irf5+/+ (n = 16), Irf5+/− (n = 16), and Irf5−/− (n=23) RII female mice. B and C, Serum IgG isotype concentrations (B) and serum ANA titers (C) from Irf5+/+ (n = 13), Irf5+/− (n = 12), and Irf5−/− (n=14) RII female mice. D, Quantitation of renal disease in Irf5+/+ (n = 14), Irf5+/− (n = 19), and Irf5−/− (n=21) RII female mice as shown by cell number per glomerulus, percentage of glomeruli with crescents, and interstitial disease score. E and F, Representative examples (E) and quantitation (F) of glomerular IgG and complement C3 deposition measured by fluorescence intensity (luminosity) in Irf5+/+ (n = 6), Irf5+/− (n = 6), and Irf5−/− (n=6) RII female mice. G, IRF5 mRNA (left panel, RT-PCR) and protein (middle panel, Western blot) expression in B220+ splenocytes from 19 wk old Irf5+/+ (n = 3), Irf5+/− (n = 3), and Irf5−/− (n=3) RII female mice and 13 wk old C57BL/6 wildtype mice (WT; n=3). A representative Western blot is shown in the right panel. Data are presented as mean ± SEM. *, p < 0.05; **, p< 0.01; ***, p < 0.001; ****, p < 0.0001 by Mann-Whitney U test.
FIGURE 6
FIGURE 6
Autommune disease parameters in IFNAR1-deficient RII.Yaa mice. Ifnar1+/+ (n = 10) and Ifnar1−/− (n=11) RII.Yaa mice were analyzed at 5 months of age. A, Serum IgG isotype concentrations. B, Anti-nuclear autoantibody (ANA) titers in serum; ND, not detected. C, Anti-ribonucleoprotein (SmRNP) autoantibody levels in serum. D, Autoantigen array analysis was performed on sera. Samples are arranged with hierarchical clustering and displayed as a heat map. Antigens are ordered using the order defined by the SAM observed score in Fig. 3D. Significance Analysis of Microarrays identified no significant differences between the Ifnar1+/+ and Ifnar1−/− groups. E, Lymph node and spleen weights. F, Quantitation of renal disease as shown by cell number per glomerulus, percentage of glomeruli with crescents, and interstitial disease score. G, Glomerular IgG and complement C3 deposition in Ifnar1+/+ (n = 6) and Ifnar1−/− (n=6) RII.Yaa mice. H, Serum blood urea nitrogen (BUN) levels in Ifnar+/+ (n = 8) and Ifnar−/− (n=10) RII.Yaa mice. Bars represent median values (C). Data are presented as mean ± SEM *, p < 0.05; **, p< 0.01; ****, p < 0.0001 by Mann-Whitney U test. H, Ifnar1+/+ (black line, n = 12) and Ifnar1−/− (red line, n=14) RII.Yaa mice were observed until the time of death. **, p = 0.0043, logrank test.

Similar articles

Cited by

References

    1. Rhodes B, Vyse TJ. The genetics of SLE: an update in the light of genome-wide association studies. Rheumatology (Oxford) 2008;47:1603–1611. - PubMed
    1. Simard JF, Costenbader KH. What can epidemiology tell us about systemic lupus erythematosus? Int J Clin Pract. 2007;61:1170–1180. - PubMed
    1. Rahman A, Isenberg DA. Systemic lupus erythematosus. N Engl J Med. 2008;358:929–939. - PubMed
    1. Lauwerys BR, Wakeland EK. Genetics of lupus nephritis. Lupus. 2005;14:2–12. - PubMed
    1. Harley IT, Kaufman KM, Langefeld CD, Harley JB, Kelly JA. Genetic susceptibility to SLE: new insights from fine mapping and genome-wide association studies. Nat Rev Genet. 2009;10:285–290. - PMC - PubMed

Publication types

Associated data