. 2009 Dec 15;183(12):7768-77.
doi: 10.4049/jimmunol.0902333.

Asynchronous RAG-1 expression during B lymphopoiesis

Affiliations

Asynchronous RAG-1 expression during B lymphopoiesis

Robert S Welner et al. J Immunol. .

Abstract

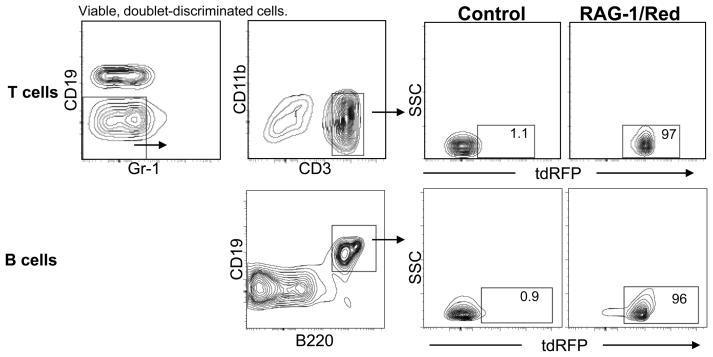
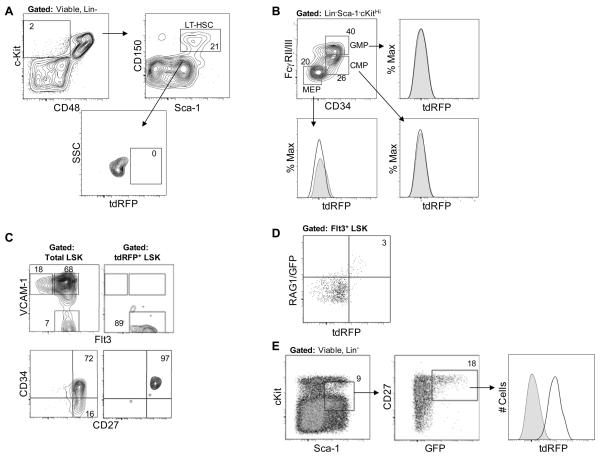
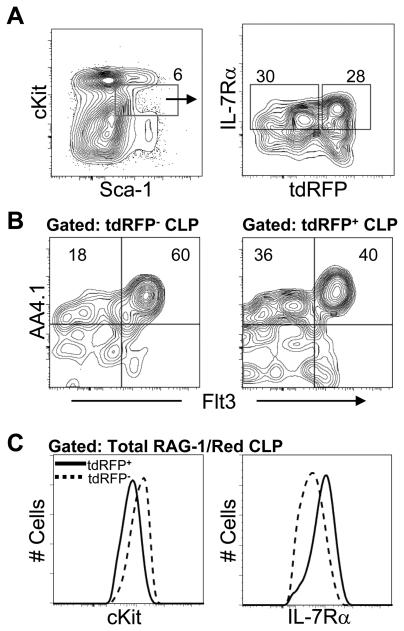
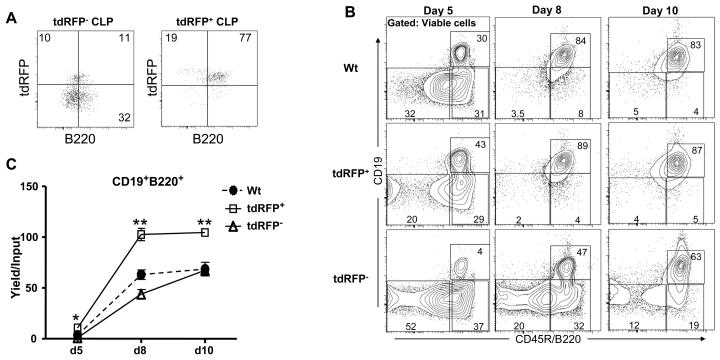
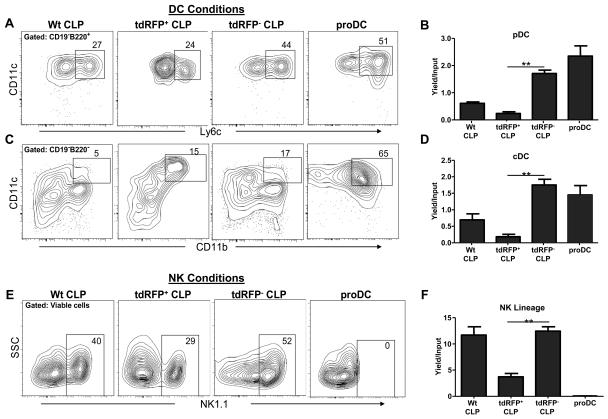
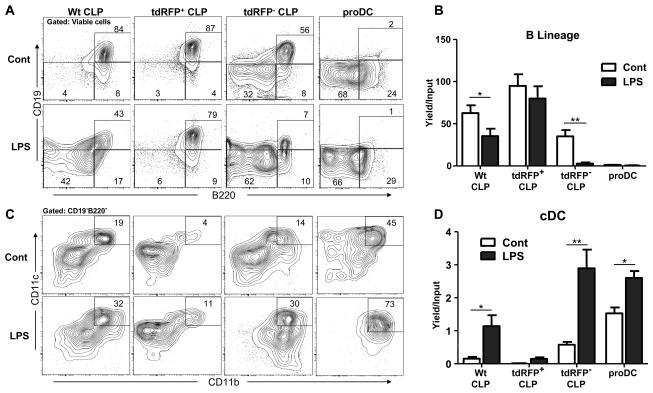
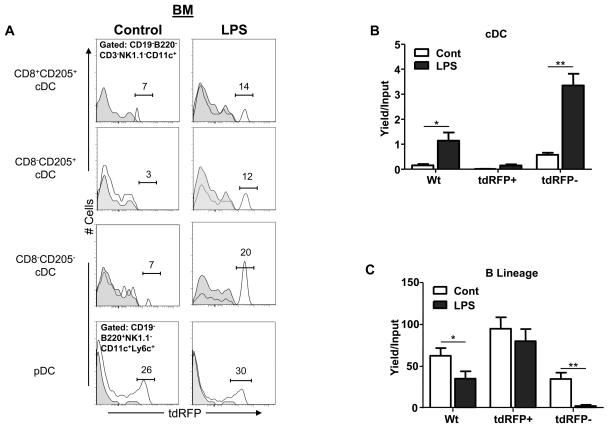
Changes in cell surface markers and patterns of gene expression are commonly used to construct sequences of events in hematopoiesis. However, the order may not be as rigid as once thought and it is unclear which changes represent the best milestones of differentiation. We developed a fate-mapping model where cells with a history of RAG-1 expression are permanently marked by red fluorescence. This approach is valuable for appreciating lymphoid-lineage relationships without need for irradiation and transplantation. Hematopoietic stem cells (HSC) as well as myeloid and dendritic cell progenitors were unlabeled. Also as expected, most previously identified RAG-1(+) early lymphoid progenitors in bone marrow and all lymphoid-affiliated cells were marked. Of particular interest, there was heterogeneity among canonical common lymphoid progenitors (CLP) in bone marrow. Labeled CLP expressed slightly higher levels of IL-7Ralpha, displayed somewhat less c-Kit, and generated CD19(+) lymphocytes faster than the unlabeled CLP. Furthermore, CLP with a history of RAG-1 expression were much less likely to generate dendritic and NK cells. The RAG-1-marked CLP were lineage stable even when exposed to LPS, while unlabeled CLP were redirected to become dendritic cells in response to this TLR4 ligand. These findings indicate that essential events in B lymphopoiesis are not tightly synchronized. Some progenitors with increased probability of becoming lymphocytes express RAG-1 while still part of the lineage marker-negative Sca-1(+)c-Kit(high) (LSK) fraction. Other progenitors first activate this locus after c-Kit levels have diminished and cell surface IL-7 receptors are detectable.


Figures

Figure 1
Figure 1. Validation of a new fate mapping model for cells with a history of RAG-1 expression
The contour plots demonstrate the gating criteria used, and compare results obtained with wild type control and RAG-1/Red mice. Gr-1CD19CD11bCD3+ T cells and B220+CD19+B lineage cells in the spleen are shown.
Figure 2
Figure 2. Pro-lymphocytes with an active RAG-1 locus or marked by prior RAG-1 expression can be detected in reporter mouse models
(A) Rigorously defined long-term HSC (LinCD48cKitHISca1+CD150+) were gated based on controls to determine the level of tdRFP expression within this subset. (B) Myelo-erythroid progenitors in bone marrow of RAG-1/Red mice were gated as indicated in the left panel. These LinSca-1cKitHi myeloid progenitors include MEP (CD34RII/IIIγFc), CMP (CD34+RII/IIIγFclo/−), and GMP (CD34+RII/IIIγFc+). The tdRFP fluorescence in cells harvested from RAG-1/Red mice (open histograms) is shown in comparison to that from wild type mice (shaded histograms). LinSca-1cKitHiCD34+FcγRLo common myeloid progenitors were discriminated from CD34+FcγRHi granulocyte/macrophage progenitors and CD34FcJR-megakaryocyte-erythrocyte progenitors. (C) Subsets of LinSca1+cKitHi (LSK) have been resolved based on surface marker expression. LMPP (Flt3Hi LSK) and ELP (CD27+VCAM1 LSK) were resolved to determine the presence of tdRFP expression within the cKitHi populations. (D) RAG-1/GFP mice were crossed with RAG-1/Red mice to determine the tdRFP expression within the cKitHiRAG1+ ELP (as previously described). (E) Previously defined pro-lymphocytes (ProL, LincKitLoSca-1+CD27+RAG-1/GFP+) from RAG-1/GFP x RAG-1/Red mice marrow were analyzed by flow cytometry to evaluate their expression of tdRFP (right panel, open histogram) These were compared to tdRFP expression from control RAG-1/GFP mice (shaded histogram). The flow cytometry plots are bi-exponential, and the data are representative of two independent experiments.
Figure 3
Figure 3. A subset of common lymphoid progenitors derive from RAG-1 expressing cells
(A) The canonical LincKitLoSca-1+IL-7RD+ CLP population was resolved as shown and found to be heterogeneous with respect to tdRFP fluorescence. (B) Total CLP identified in marrow from wild type (Wt) mice were then compared to the tdRFP+ CLP subset by staining with Flt3 and AA4.1. (C) The red labeled CLP were also compared to their unlabeled cohort with respect to cKit and IL-7RD densities. The data are representative of at least three experiments with at least three mice of each type per group.
Figure 4
Figure 4. Activation of the RAG-1 locus corresponds to more rapid generation of B lineage lymphocytes
(A) Red labeled and unlabeled CLP were sorted and cultured in serum/stromal cell-free conditions enriched with SCF, FL and IL-7 for 24 hours. Dot plots show expression of B220 and tdRFP by gated viable, cKit+ cells derived from each cultured subset. (B) CLP from control mice (Wt), or the tdRFP+ and tdRFP CLP cohort from RAG-1/Red mice were sorted and cultured as above. The cultures were harvested at the indicated times and examined by flow cytometry. Percentages of viable cells in the gated areas are given to indicate populations containing B lineage lymphocytes or enriched for dendritic cell subsets (see text). (C) Average yields ± SEM of CD19+B220+ cells recovered per input CLP were calculated. The data are representative of three independent experiments with three wells per group per experiment. Statistical significance between means of tdRFP+ and tdRFP CLP yields were determined by unpaired, two-tailed t-test analysis; *p< 0.5 and **p<0.01.
Figure 5
Figure 5. Cells with a history of RAG-1 expression have reduced potential to generate pDC, cDC and NK cells
Total CLP from wild type mice, CLP subsets differing for tdRFP fluorescence and proDC were sorted and cultured for 10 days under conditions optimal for producing dendritic cells (SCF and FL, but no IL-7). The flow cytometry (A, C) and yield results (B, D) of those experiments are shown. Yields are expressed as numbers of cells ± SEM produced per progenitor used to initiate cultures. Total CLP from wild type mice and dendritic cell restricted proDC were included for comparison. The non-lymphoid CD19 cells produced from each of these four cell types were further analyzed with respect to CD11c, Ly6C, and CD11b to assess B220+ pDC (A, B) and B220 cDC (C, D) potential, respectively. The plots are representative of two experiments with four culture wells/group. The numbers in (A) and (C) refer to cells in the indicated gates as average percentages of total CD19B220+ or CD19B220 cells, respectively observed in all experiments. (E and F) The same four types of progenitors were placed in two-step cultures under conditions optimal for observing NK lineage development. In this circumstance, IL-15 replaced IL-7 after five days of culture, and flow cytometry was performed with cells harvested five days later. The numbers in panel (E) are percentages of total viable recovered cells that express NK1.1. The results are representative of three dendritic cell and four NK cell culture experiments, where there were always four culture wells per group. Statistical significance was determined by unpaired, two-tailed t-test analyses; *p< 0.5 and **p<0.01.
Figure 6
Figure 6. A TLR ligand preferentially selects the tdRFP CLP subset for redirection to dendritic cell fates
Control (Wt), tdRFP+ and tdRFP subsets of CLP as well as proDC were sorted and placed in serum/stromal cell-free cultures containing SCF, FL and IL-7 for 10 days. Some wells contained LPS (10Pg/mL as indicated). All wells were washed after the initial 48 hours, and cultured for another eight days. (A and B) CD19+B220+ B lineage production was assessed. (C and D) CD19B220CD11c+CD11b+ cDC production was also evaluated. Numbers represent average frequencies of viable cells (A), while numbers in (C) indicate average frequencies of the CD19B220 gates shown in (A). Average yields ± SEM per input progenitor are shown in (B and D). The data are representative of at least three experiments with four wells per experimental group. Statistical significance was determined by unpaired, two-tailed t-test analysis; *p< 0.5 and **p<0.01.
Figure 7
Figure 7. Recently identified proDC/CDCP are not closely related to lymphoid lineage cells
(A) ProDC sorted from RAG-1/Red mice were sorted and cultured in parallel with total CLP and CLP subsets to determine their potential to generate tdRFP labeled cDC (left panel) or pDC (right panel). These cultures were maintained for 7 days before flow cytometry analysis. (B) Multipotent progenitors (MPP), common myeloid progenitors (CMP) and lymphoid progenitors (CLP) were isolated from normal control or LPS treated C57BL/6 mice and placed in culture. Cells were harvested at the indicated time points to determine if they generated proDC. (C) Mice were given time-release pellets containing placebo or 17 E-estradiol and bone marrow was analyzed 7 days later to determine the hormone sensitivity of lympho-myeloid progenitors. The bars represent average ± SEM numbers of progenitors in estrogen treated mice as compared to normal placebo controls. (D) Mice were injected with 100 Pg of LPS and marrow was harvested 48 hr later. Flow cytometry was used to assess the abundance of proDC. Similar results were obtained in three independent experiments. Statistical significance is indicated by *p<0.05 and ** p<0.01.
Figure 8
Figure 8. TLR stimulation increases tdRFP labeling in some cDC subsets in vivo
(A) Mice were injected i.p. with 100 μg LPS, and tdRFP expression in bone marrow cDC subsets was analyzed by flow cytometry one week later. Corresponding values for spleen and thymus are found in Table 1. Shaded histograms provide results with wild type mice, while data for RAG-1/Red mice are given in open histograms. Similar results were obtained in 3 independent experiments, with two to four mice per group per experiment. (B) Total CLP were sorted from C57BL/6 mice and CLP subsets were isolated from RAG-1/Red mice and placed in defined cultures. Conventional DC yields per input progenitor are given. (C) Yields of B lineage cells harvested from the same cultures are shown.

Similar articles

Cited by

References

    1. Nagai Y, Garrett KP, Ohta S, Bahrun U, Kouro T, Akira S, Takatsu K, Kincade PW. Toll-like receptors on hematopoietic progenitor cells stimulate innate immune system replenishment. Immunity. 2006;24:801–812. - PMC - PubMed
    1. Welner RS, Pelayo R, Nagai Y, Garrett KP, Wuest TR, Carr DJ, Borghesi LA, Farrar MA, Kincade PW. Lymphoid precursors are directed to produce dendritic cells as a result of TLR9 ligation during herpes infection. Blood. 2008;112:3753–3761. - PMC - PubMed
    1. Blijlevens NM, Donnelly JP, De Pauw BE. Prospective evaluation of gut mucosal barrier injury following various myeloablative regimens for haematopoietic stem cell transplant. Bone Marrow Transplant. 2005;35:707–711. - PubMed
    1. Schwarz BA, Sambandam A, Maillard I, Harman BC, Love PE, Bhandoola A. Selective thymus settling regulated by cytokine and chemokine receptors. J. Immunol. 2007;178:2008–2017. - PubMed
    1. Manz MG, Traver D, Miyamoto T, Weissman IL, Akashi K. Dendritic cell potentials of early lymphoid and myeloid progenitors. Blood. 2001;97:3333–3341. - PubMed

Publication types

MeSH terms