. 2009 Dec 15;183(12):8077-87.
doi: 10.4049/jimmunol.0801117.

Inflation and long-term maintenance of CD8 T cells responding to a latent herpesvirus depend upon establishment of latency and presence of viral antigens

Affiliations

Inflation and long-term maintenance of CD8 T cells responding to a latent herpesvirus depend upon establishment of latency and presence of viral antigens

Anna Lang et al. J Immunol. .

Abstract

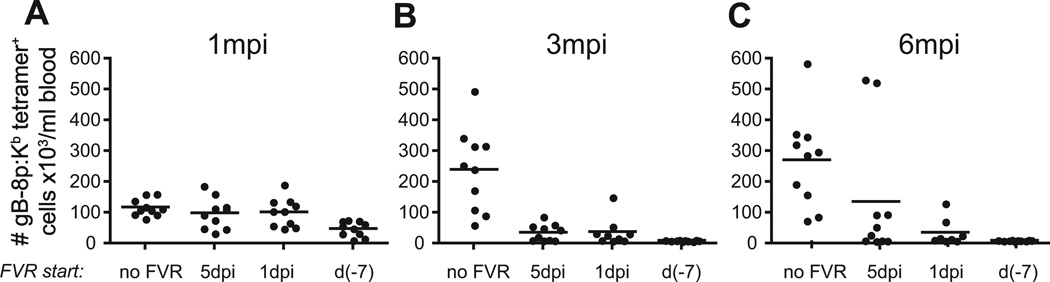
Following the priming and contraction phases of the T cell response, latent persistent herpesviruses lead to an accumulation of large pools of virus-specific CD8 T cells, also known as memory inflation (MI). The mechanism of this inflation is incompletely understood, largely because the molecular reactivation of these viruses in vivo and its impact upon T cell biology have not been resolved in mice, and because the relevant observations in humans remain, by necessity, correlative. Understanding these processes is essential from the standpoint of the proposed critical role for latent herpesviruses in aging of the immune system. We studied the causes of memory CD8 T cell accumulation following systemic HSV-1 administration as a model of widespread latent viral infection in humans. A direct role of viral latency and Ag-specific restimulation in driving the accumulation and maintenance of inflated CD8 T cells and a strongly suggested role of viral reactivation in that process were shown by the following: 1) lack of MI in the absence of established latency; 2) prevention or delay of MI with drugs that curtail viral replication; and 3) abrogation of MI by the transfer of inflated T cells into a virus-free environment. These results strongly suggest that periodic, subclinical reactivations of a latent persistent virus cause dysregulation of memory CD8 T cell homeostasis, similar to the one in humans. Moreover, results with antiviral drugs suggest that this approach could be considered as a treatment modality for maintaining T cell diversity and/or function in old age.


Figures

Figure 1
Figure 1
Early onset of memory inflation following systemic HSV-1 infection A–B. Two cohorts of young mice were infected with 106 PFU HSV-1 via localized infection (triangles, n = 10) or systemic (circles, n = 8) infection route. Blood samples were taken at indicated timepoints and stained with anti-CD8 and gB-8p:Kb tetramer. The values (A) represent the average percent of tetramer+ cells within CD8 T-cells over time (± SD), which was significantly different between groups from day 45pi onwards (at least at p < 0.05). The difference in numbers (B) of tetramer+ cells was determined at 12 m.p.i. and was also statistically significant. C – D. Infection with acute virus, rVV-gB, does not results in memory inflation. Two cohorts of young mice were infected with 106 PFU HSV-1 (C, n=11) or rVV-gB (D, n=11) via systemic infection route. Blood samples were taken at indicated timepoints and analyzed as in (A). Each data point represents the percent of tetramer+ cells within CD8 T-cells of individual mice. Memory inflation was observed only in the HSV-1 infected group.
Figure 2
Figure 2
Despite early differences, the size and phenotype of HSV-specific CD8 T-cell response after systemic and localized HSV-1 infection are the same by day 14. A. Splenocytes from naïve gBT-I TCR transgenic mice were labeled with CFSE and splenocytes containing 2×10⁶ TCR transgenic CD8 T-cells were transferred into each congenic Ly5.2+ recipient. 24 hours post-transfer the recipient mice were infected with HSV-1 via the localized (n = 5) or the systemic (n = 5) infection route. Blood samples were taken at day 3, 5 and 10 p.i.. The graphs are gated on HSV-specific CD8 T-cells (CD8+ gB-8p:Kb tetramer+ Ly5.1+) from representative mice and show dilution of CFSE in HSV-specific CD8 T-cells at a given time point. The numbers above each gate marker represent percent of undivided cells within the HSV-specific CD8 T-cells. The data is representative of 2 independent experiments. B. Cohorts of B6 mice were infected with 106 PFUs HSV-1 via localized (n = 5, triangles) or systemic (n= 5, circles) infection route. Blood samples were taken at indicated time p.i.. and stained with anti-CD8 and gB-8p:Kb tetramer. The values show the average percent of gB-8p:Kb tetramer+ cells within CD8 T-cells (± SD) The data is representative of two independent experiments. C. The mice were infected as in B. On day 14 p.i. the absolute number of HSV-specific CD8 T-cells in spleens of infected mice was determined by staining splenocytes with gB-8p:Kb tetramer and CD8. The values show the average number of tetramer+ CD8 T-cells (± SD). D –E. Expression of CD62L (D) and CD127 (E) by gB-8p:Kb tetramer+ CD8 T-cells from part B was determined by FCM. The values show the average percent of CD62Lhi and CD127+ cells within gB-8p:Kb tetramer+ CD8 T-cells (± SD). The data is representative of two independent experiments. MI = memory inflation.
Figure 3
Figure 3
Cells undergoing MI are characterized by an effector/effector memory phenotype and retain their effector function. A. Examples of phenotypes displayed by inflating and non-inflating memory CD8 T-cells. At 12 m.p.i., blood samples from mice infected with HSV-1 via localized or systemic route were stained with CD8, tetramer, CD62L, CD127, and CD27. The graphs are gated on tetramer+ cells (infected mice) or on total CD8 T-cells from naïve age-matched mouse. The numbers represent the percent of gated cells expressing the given marker, and are representative of values obtained from the entire experimental cohort. B. Summary of expression of CD62L, CD127 and CD27 on mice infected with HSV-1 via localized (n = 10) or systemic (n = 8) route. The values show the average (± SD) percentage of CD62Lhi, CD127+ and CD27+ within the tetramer+ CD8 T-cells at 12 m.p.i. The data is representative of 3 independent experiments. C–D. Splenocytes from mice at 12 m.p.i. (n=10) were stimulated for 6 hours with 10−5 M gB-8p peptide in presence of brefeldin A, and then stained using gB-8p:Kb tetramer and CD8 (panel C, top plots) or CD8 and intracellular IFNγ (panel C, bottom plots). Representative data from three individual mice is shown in C. The data from all tested mice is summarized in D. The X values show the percent of tetramer+ cells, and the Y values shows the percent of IFNγ+ cells within total CD8+ T-cell pool of individual mice. The values for IFNγ show the net IFNγ (background IFNγ staining from unstimulated wells was subtracted; background was < 0.2%). Excellent correlation of the tetramer and IFNγ staining was observed (R2 = 0.948), indicating that the expanded Tet+ cells are functional.
Figure 4
Figure 4
Dependence of memory inflation development and maintenance on presence of antigen. A. CD8-enriched splenocytes (see Materials and Methods) pooled from mice infected i.p. with HSV-1 14 days earlier (n = 12, average % of tetramer+ CD8 T cells in donors was 3.5% at the time of transfer) were transferred into congenic Ly5.2+ recipients that were either naïve (n = 3), or infected with HSV-1 via localized (n = 3) or systemic (n = 3) route. Each recipient received 3×10⁵ tetramer+ CD8 T-cells. The percentage of tetramer+ cells within the donor CD8 T-cell population was monitored in blood on days 2, 30 and 60 post-transfer. Average values (±SD) are shown. B. Splenocytes from mice infected i.p. with HSV-1 4 months earlier (n = 3, average % of tetramer+ CD8 T cells in donors was 12% at the time of transfer) were transferred into naïve (n = 3) or systemically infected (n = 3) congenic Ly5.2+ recipients (the infected recipients were infected i.p. with HSV-1 4 months prior to transfer). Each recipient received 5×10⁵ tetramer+ CD8 T-cells. The percentage of tetramer+ cells within the donor CD8 T-cell population was monitored in blood on days 2, 7, and 30 post-transfer. Average values (±SD) are shown.
Figure 5
Figure 5
Decreasing initial viral load and interfering with viral reactivation can prevent memory inflation after systemic HSV-1 infection. Two groups of mice (n = 4 per group) were infected with HSV-1 via systemic route and their CD8 T-cell responses were followed longitudinally by staining blood samples with CD8 and tetramer. One cohort (HSV+FVR d(−7)) was given antiviral drug famciclovir (FVR) starting on day (−7), and continuing thereafter. The second cohort (HSV) was left untreated. On day 3 p.i., mice from FVR-treated and control group (n = 4/group) were sacrificed and the amount of actively replicating virus was determined in fat pads (A) and in spleen (B). In the FVR treated group, only 2 out of 4 mice had any detectable virus in their fat pads, and no virus was detected in their spleens (n.d.). The average percentage (C) and number (D) of tetramer+ cells within CD8 T-cells was determined. The asterisks in panels C and D indicate a statistically significant (p < 0.05, Student's t-test) difference between the FVR-treated and control groups. (E) Significant differences in expression of CD62L, CD127 and CD27 were observed between the FVR-treated and control groups at 180 d.p.i. The values show the average percentage (±SD) of cells with given phenotype within the tetramer+ CD8 T-cells.
Figure 6
Figure 6
Timing of famciclovir (FVR) treatment initiation determines the kinetics and extent of MI. Cohorts of mice (8–10/group) were infected systemically with HSV-1 and their gB-8p-specific CD8 T-cell responses were monitored in blood over time. Four groups were analyzed: control (no famciclovir, no FVR in the legend), and three groups of mice in which FVR treatment was started on day 5 p.i., day 1 p.i. or 7 days prior to infection. Once started, FVR was administered continuosly throughout the duration of the experiment. The number of tetramer+ cells/ml blood is shown for individual mice per group at 1 (A), 3 (B) and 6 m.p.i. (C). The data is representative of two independent experiments.
Figure 7
Figure 7
Dependence of in vivo proliferation of memory CD8 T-cells on presence of antigen. Cohorts of B6 mice were systemically infected with HSV-1 and their gB-8p-specific CD8 T-cell response was monitored in blood over time. (A). One group was left untreated (HSV only, n = 8), whereas the second group was continuously treated with FVR starting on day 14 p.i. (HSV + FVR, n = 8). At 7 m.p.i. mice from both groups were given BrdU in their drinking water for 3 weeks to monitor in vivo T cell proliferation. The loss of BrdU label (BrdU chase) was monitored over the course of 5 weeks following termination of BrdU treatment. Mice in HSV+FVR group continued to receive FVR during BrdU treatment. B–C. Percent of BrdU+ cells within tetramer+ or tetramer CD8 T-cell populations in FVR treated (B) or untreated control (C) group. Average values (±SD) are shown. D. Percent of BrdU+ cells within tetramer+ CD8 T-cell populations from FVR treated or untreated control group. Average values (±SD) are shown. E. The change in frequency of Tet+ cells in both cohorts (famvir-treated - filled bars; control - open bars), respectively was monitored during the chase period. The frequency measured at the start of chase was taken as 100% and the frequencies detected at 0 and 5 week timepoints were calculated accordingly. Overall, this corresponded to absolute values of 3±1.6 and 6.3±1.1 × 10⁵ of gB-specific CD8 cells in famvir-treated and control mice, respectively.
Figure 8
Figure 8
Comparison of in vivo proliferation and maintenance of memory CD8 T cells in blood and spleen. Cohorts of B6 mice were infected with HSV-1 as in Fig. 7. One group (HSV only, n=8)) was left untreated, and the second was continuously treated with FVR starting on day 5 p.i. (HSV + FVR, n=8). Both groups were given BrdU in their drinking water for 3 weeks (day 77–98 p.i.). The percentage (A, B) and number (C,D) of Tet+ cells, as well the loss of BrdU label by Tet+ CD8 T-cells (E, F) was analyzed in blood (A,C,E) and spleen (B,D,F) during 16 weeks following the end of BrdU labeling (day 98–210 p.i.). G–H. The expression of CD62L, CD127 and CD27 was evaluated on Tet+ CD8 T-cells in blood (G) and spleen (H) on day 210 p.i. The results are presented as percentage of CD62Lhi, CD127+ and CD27+ cells within Tet+ CD8+ T-cells (±SD).

References

    1. Pawelec G, Akbar A, Caruso C, Effros R, Grubeck-Loebenstein B, Wikby A. Is immunosenescence infectious? Trends Immunol. 2004;25:406–410. - PubMed
    1. Sylwester AW, Mitchell BL, Edgar JB, Taormina C, Pelte C, Ruchti F, Sleath PR, Grabstein KH, Hosken NA, Kern F, Nelson JA, Picker LJ. Broadly targeted human cytomegalovirus-specific CD4+ and CD8+ T cells dominate the memory compartments of exposed subjects. J Exp Med. 2005;202:673–685. - PMC - PubMed
    1. Munks MW, Gold MC, Zajac AL, Doom CM, Morello CS, Spector DH, Hill AB. Genome-wide analysis reveals a highly diverse CD8 T cell response to murine cytomegalovirus. J Immunol. 2006;176:3760–3766. - PubMed
    1. Wikby A, Ferguson F, Forsey R, Thompson J, Strindhall J, Lofgren S, Nilsson BO, Ernerudh J, Pawelec G, Johansson B. An immune risk phenotype, cognitive impairment, and survival in very late life: impact of allostatic load in Swedish octogenarian and nonagenarian humans. J Gerontol A Biol Sci Med Sci. 2005;60:556–565. - PubMed
    1. Mocarski ES, C CT. Cytomegaloviruses and their replication. In: Knipe DM, Howley PM, editors. Fields - Virology. Philadelphia: Lippincot Williams & Wilkins; 2001. pp. 2629–2674.

Publication types

MeSH terms