. 2010 Mar;38(5):1596-609.
doi: 10.1093/nar/gkp1145. Epub 2009 Dec 9.

Gene silencing by cell-penetrating, sequence-selective and nucleic-acid hydrolyzing antibodies

Affiliations

Gene silencing by cell-penetrating, sequence-selective and nucleic-acid hydrolyzing antibodies

Woo-Ram Lee et al. Nucleic Acids Res. 2010 Mar.

Abstract

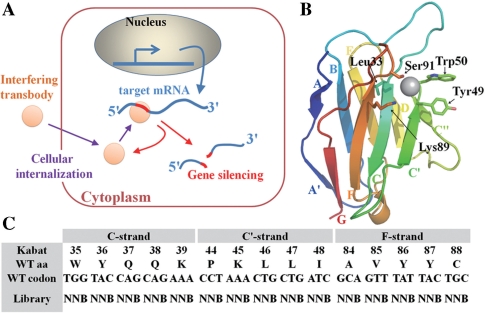
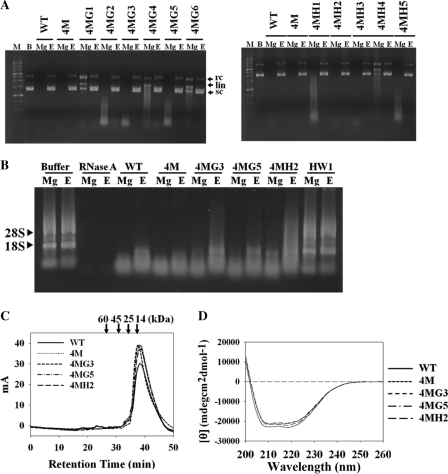
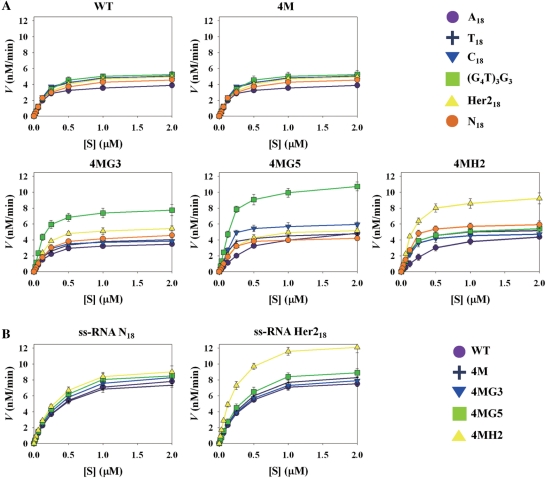
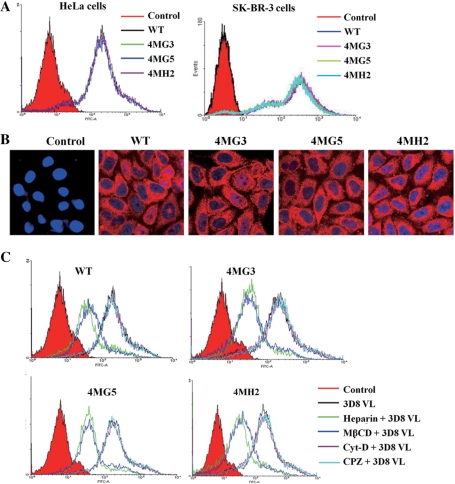
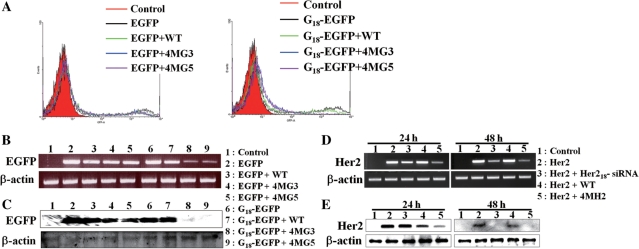
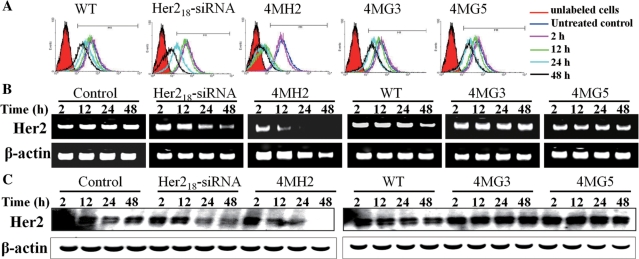
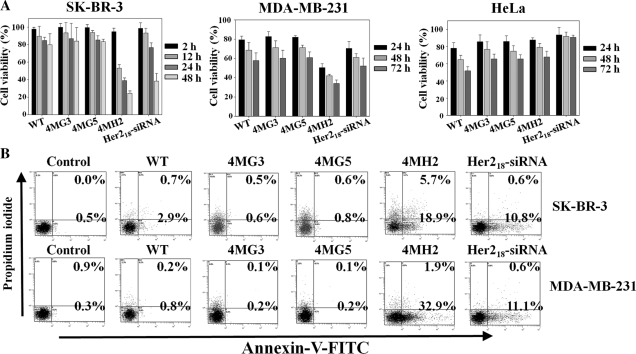
Targeting particular mRNAs for degradation is a fascinating approach to achieve gene silencing. Here we describe a new gene silencing tool exploiting a cell-penetrating, nucleic-acid hydrolyzing, single-domain antibody of the light-chain variable domain, 3D8 VL. We generated a synthetic library of 3D8 VL on the yeast surface by randomizing residues located in one of two beta-sheets. Using 18-bp single-stranded nucleic acids as target substrates, including the human Her2/neu-targeting sequence, we selected 3D8 VL variants that had approximately 100-1000-fold higher affinity and approximately 2-5-fold greater selective hydrolyzing activity for target substrates than for off targets. 3D8 VL variants efficiently penetrated into living cells to be accumulated in the cytosol and selectively decreased the amount of target sequence-carrying mRNAs as well as the proteins encoded by these mRNAs with minimal effects on off-target genes. In particular, one 3D8 VL variant targeting the Her2 sequence showed more efficient downregulation of Her2 expression than a small-interfering RNA targeting the same Her2 sequence, resulting in apoptotic cell death of Her2-overexpressing breast cancer cells. Our results demonstrate that cell-penetrating 3D8 VL variants with sequence-selective, nucleic-acid-hydrolyzing activity can selectively degrade target mRNAs in the cytosol, providing a new gene silencing tool mediated by antibody.


Figures

Figure 1.
Figure 1.
(A) Schematic diagrams showing the concept of the interfering transbody. Cell-penetrating antibody (transbody) equipped with sequence-specific nucleic-acid-hydrolyzing activity penetrates into the cytosol of living cells and preferentially recognizes and hydrolyzes the target mRNA, leading to target gene silencing. (B) Structural characteristics of 3D8 VL. Three-dimensional structure of the complex between 3D8 VL WT and Co2+ (gray ball) (PDB code 3BD5) (17). The putative catalytic residues are highlighted and described in detail in the text. Each β-strand is indicated by a different color code. (C) 3D8 VL library generation scheme. The library was generated by randomizing 15 putative nucleic-acid binding residues in the groove composed of the C- (35–39 residues), C′- (44–48 residues) and F-strands (84–88 residues) with a degenerate codon of NNB (N = A/T/G/C, B = C/G/T) based on 3D8 VL 4M as a template (Supplementary Figure S1). Numbering is according to the Kabat definition (12). Amino acids and nucleotide bases are indicated in single-letter code according to IUPAC.
Figure 2.
Figure 2.
Biochemical characterization of representative 3D8 VL variants selected against ss-DNA G18 (4MG3 and 4MG5) and Her218 ss-DNA (4MH2), compared with 3D8 VL WT and 4M. (A) DNA hydrolyzing activity analyses of primarily isolated 3D8 VLs selected against ss-DNA G18 (4MG1-4MG6) and Her218 ss-DNA (4MH1-4MH5) by agarose gel electrophoresis, compared with 3D8 VL WT and 4 M. The supercoiled plasmid of pUC19 (2.2 nM) was incubated with 3D8 VLs (5 μM) for 1 h at 37°C in the TBS buffer, pH 7.4, containing 2 mM MgCl2 (indicated as ‘Mg’) or 50 mM EDTA (indicated as ‘E’). The reaction mixtures were analyzed by electrophoresis on 0.7% agarose gels, and then stained with ethidium bromide. The arrows indicate supercoiled (sc), linear (lin) and relaxed circular (rc) DNAs. The samples incubated with only buffer alone and molecular mass markers were designated as ‘B’ and ‘M’, respectively. (B) RNA-hydrolyzing activity of 3D8 VLs, including WT, 4M, G18-selective 4MG3 and 4MG5, and Her218-selective 4MH2. Total cellular RNA (1 μg) extracted from HeLa cells were incubated at 37°C for 2 h in TBS buffer, pH 7.4, containing 2 mM MgCl2 (indicated as ‘Mg’) or 50 mM EDTA (indicated as ‘E’) with 3D8 VLs (0.1 μM), RNase A (1 U), irrelevant HW1 scFv protein (0.1 μM) as a negative control prior to gel electrophoresis. The bands corresponding to rRNAs of 28S and 18S are indicated. (C) SEC elution profiles of representative 3D8 VLs (∼12 kDa). Each protein (20 μM ≈ 260 μg/ml in TBS, pH7.4) indicated in different lines was injected and chromatograms were obtained by absorbance at 280 nm. Arrows indicate the elution positions of mass standard markers (Sigma) [BSA (66 kDa), ovalbumin (45 kDa), chymotrypsinogen A (25 kDa), ribonuclease A (13.7 kDa)]. (D) Far-UV CD spectra of representative 3D8 VLs (100 μg/ml in TBS, pH7.4) to monitor the secondary structure are shown.
Figure 3.
Figure 3.
Sequence-specific ss-DNA/RNA hydrolyzing assay of 3D8 VL variants selected against ss-DNA G18 (4MG3 and 4MG5) and Her218 (4MH2), compared with 3D8 VL WT and 4M. (A and B) Substrate-concentration dependent initial hydrolyzing velocity (V) of 3D8 VLs were plotted against various 18-bp ss-DNA substrate (S) concentrations (A) or 18-bp ss-RNA substrate (S) concentrations (B). Each protein (100 nM) was incubated at 37°C with the indicated substrates (16 nM to 2μM), which were double-labeled with 6-FAM at 5′-terminus and its quencher BHQ-1 at 3′-terminus and real-time ss-DNA/RNA hydrolyzing kinetic data were monitored by the fluorescence intensity increase caused by the 6-FAM release from its quencher BHQ-1 due to the hydrolysis (7,18). Due to the difficulty in synthesizing double-labeled ss-DNA G18. 18-bp ss-DNA substrate of (G4T)3G3 was used as the G18 substrate. The detailed enzymatic kinetic parameters are shown in Table 2. All data points are represented as mean ± SD of three experiments. Lines through mean values represent a mathematical fit of the data using the Michaelis–Menten equation.
Figure 4.
Figure 4.
3D8 VL variants penetrate into living cells by interaction with heparin sulfate proteoglycan on the cell surface and localize dominantly in the cytosol. (A) Cellular internalization of 3D8 VLs in HeLa (left panel) and SK-BR-3 (right panel) cells, monitored by flow cytometry. HeLa and SK-BR-3 cells were treated with each 3D8 VL (10 μM) for 2 h at 37°C and then with trypsin to remove surface bound proteins before immunofluorescent labeling of 3D8 VLs with rabbit anti-3D8 polyclonal antibodies and TRITC-labeled anti-rabbit IgG for flow cytometry. (B) Internalization and subcellular localization of 3D8 VLs in HeLa cells, untreated (‘control’) or treated with 10 μM 3D8 VLs at 37°C for 2 h prior to analysis by confocal fluorescence microscopy. 3D8 VLs were stained with rabbit anti-3D8 polyclonal antibodies and TRITC-labeled anti-rabbit IgG (Red). Blue color depicts DAPI-stained nuclei. Centered single confocal sections are shown. Magnification, × 400. (C) Effect of pre-treatment of soluble heparin or specific endocytosis inhibitors on the 3D8 VLs cellular uptake, analyzed by flow cytometry. HeLa cells were incubated with 3D8 VLs (10 μM) for 2 h at 37°C with or without pre-treatment of soluble heparin (100 IU/ml), CPZ (10 μg/ml), MβCD (5 mM) and Cyt-D (1 μg/ml) for 30 min prior to flow cytometric analyses.
Figure 5.
Figure 5.
Target gene silencing activity of cell-penetrating 3D8 VL variants in HeLa cells expressing exogenous targeted genes. (A–C) HeLa cells were untransfected (‘control’) or transfected with plasmids encoding EGFP or G18-EGFP, and 12 h later either untreated or treated at 37°C for 2 h with 3D8 VL WT (10 μM) and G18-selective 4MG3 (10 μM) and 4MG5 (10 μM), and further incubated for 12 h before EGFP expression analyses by flow cytometry (A), RT–PCR (B) and western blotting (C). (D and E) Her2-negative HeLa cells were untransfected (‘control’) or transfected with a plasmid encoding the full-length Her2 gene, and 24 h later were either untreated or treated at 37°C for 2 h with 3D8 VL WT (10 μM) and Her218-selective 4MH2 (10 μM). After further incubation for 24 or 48 h, Her2 expression was analyzed by RT-PCR (D) and western blotting (E). After 24 h post-transfection with Her2 gene, HeLa cells were also transfected with Her218-siRNA (500 nM) prior to analyses of Her2 expression at the indicated time. (B–E) Endogenous β-actin served as the protein loading and mRNA abundance control for western blotting and RT-PCR analyses, respectively.
Figure 6.
Figure 6.
Cell-penetrating Her218-selective 4MH2 knocks-down endogenous Her2 expression in Her2-overexpressing SK-BR-3 cells. SK-BR-3 cells were untreated (‘control’) or treated with 3D8 VLs (10 μM) for 2 h at 37°C, or transfected with Her218-siRNA (500 nM). Her2 expression was monitored at the cell-surface by flow cytometry (A), at the mRNA level by RT-PCR (B) and at the protein level by western blotting (C) at indicated periods of post-treatment with 3D8 VLs or post-transfection with Her218-siRNA (500 nM). Endogenous β-actin served as the protein loading and mRNA abundance control for western blotting and RT-PCR analyses, respectively. ‘Control’ indicates untreated cells.
Figure 7.
Figure 7.
Cell-penetrating Her218-selective 4MH2 induces apoptotic cell death of Her2-overexpressing cells. (A) Cell viability assay of Her2-overexpressing SK-BR-3 and MDA-MB-231 cells and Her2-negative HeLa cells at the indicated periods of post-treatment with 3D8 VLs (10 μM) for 2 h at 37°C or post-transfection of Her218-siRNA (500 nM), as monitored by the MTT assay. Percent cell viability was calculated with respect to the untreated control cells. (B) Flow cytometry analysis of Annexin-V-FITC and PI staining of Her2-overexpressing SK-BR-3 and MDA-MB-231 cells at 12 h post-treatment with medium only (‘control’) or with 3D8 VLs (10 μM) for 2 h at 37°C, or at 12 h post-transfection with Her218-siRNA (500 nM). In the dot plots, Annexin-V-FITC+/PI cells (lower right quadrant, % shown) and Annexin-V-FITC+/PI+ cells (upper right quadrant, % shown) are considered as ‘early apoptotic’ and ‘dead’ cells, respectively.

Similar articles

Cited by

References

    1. Scherer LJ, Rossi JJ. Approaches for the sequence-specific knockdown of mRNA. Nat. Biotechnol. 2003;21:1457–1465. - PubMed
    1. Tafech A, Bassett T, Sparanese D, Lee CH. Destroying RNA as a therapeutic approach. Curr. Med. Chem. 2006;13:863–881. - PubMed
    1. Carthew RW, Sontheimer EJ. Origins and Mechanisms of miRNAs and siRNAs. Cell. 2009;136:642–655. - PMC - PubMed
    1. Cullen BR. Enhancing and confirming the specificity of RNAi experiments. Nat. Methods. 2006;3:677–681. - PubMed
    1. Makarov AA, Ilinskaya ON. Cytotoxic ribonucleases: molecular weapons and their targets. FEBS Lett. 2003;540:15–20. - PubMed

Publication types