. 2010 Feb 12;285(7):4920-30.
doi: 10.1074/jbc.M109.082610. Epub 2009 Dec 10.

MicroRNA-15b modulates cellular ATP levels and degenerates mitochondria via Arl2 in neonatal rat cardiac myocytes

Affiliations

MicroRNA-15b modulates cellular ATP levels and degenerates mitochondria via Arl2 in neonatal rat cardiac myocytes

Hitoo Nishi et al. J Biol Chem. .

Abstract

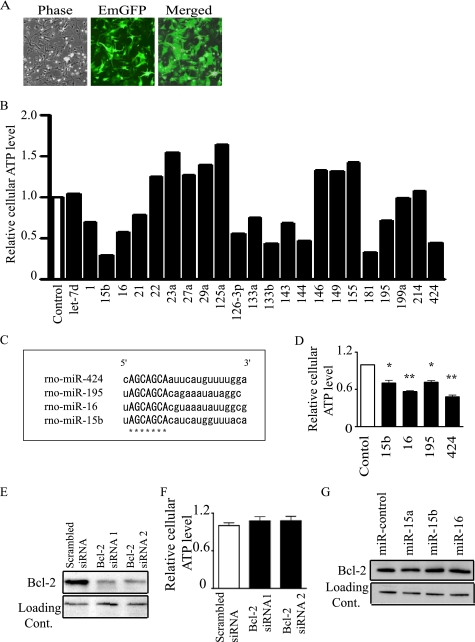
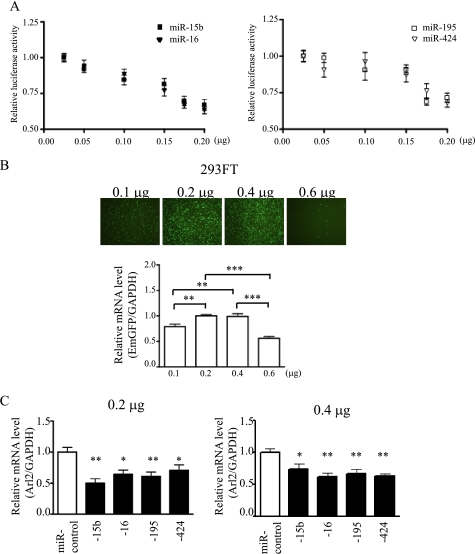
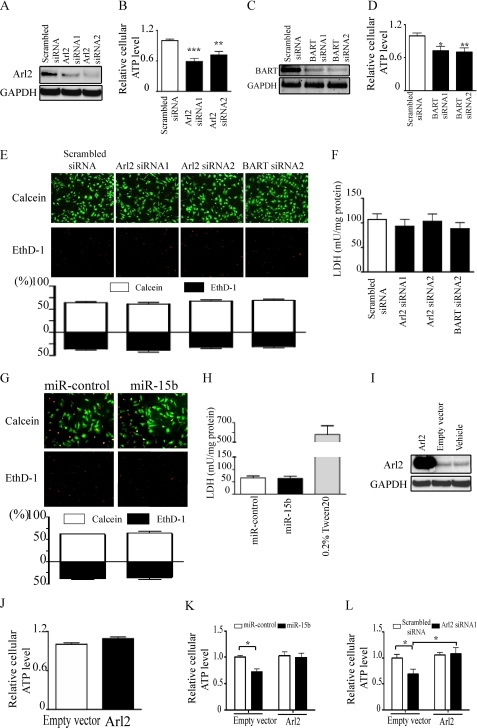
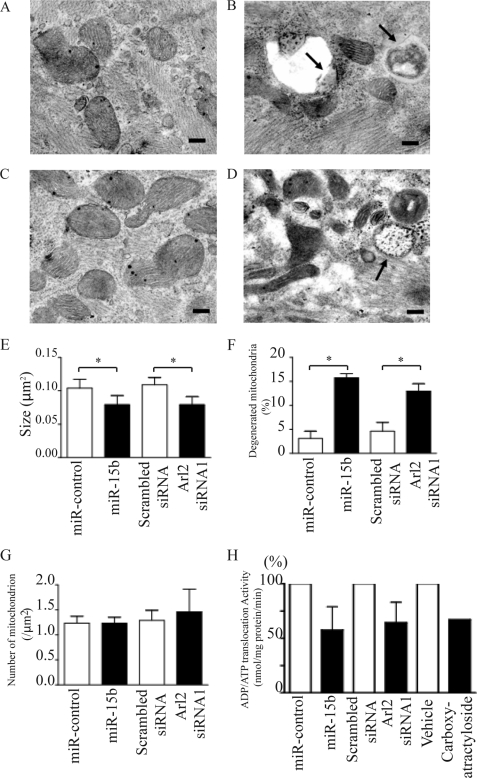
MicroRNAs (miRNAs or miRs) are small, non-coding RNAs that modulate mRNA stability and post-transcriptional translation. A growing body of evidence indicates that specific miRNAs can affect the cellular function of cardiomyocytes. In the present study, miRNAs that are highly expressed in the heart were overexpressed in neonatal rat ventricular myocytes, and cellular ATP levels were assessed. As a result, miR-15b, -16, -195, and -424, which have the same seed sequence, the most critical determinant of miRNA targeting, decreased cellular ATP levels. These results suggest that these miRNAs could specifically down-regulate the same target genes and consequently decrease cellular ATP levels. Through a bioinformatics approach, ADP-ribosylation factor-like 2 (Arl2) was identified as a potential target of miR-15b. It has already been shown that Arl2 localizes to adenine nucleotide transporter 1, the exchanger of ADP/ATP in mitochondria. Overexpression of miR-15b, -16, -195, and -424 suppressed the activity of a luciferase reporter construct fused with the 3'-untranslated region of Arl2. In addition, miR-15b overexpression decreased Arl2 mRNA and protein expression levels. The effects of Arl2 siRNA on cellular ATP levels were the same as those of miR-15b, and the expression of Arl2 could restore ATP levels reduced by miR-15b. A loss-of-function study of miR-15b resulted in increased Arl2 protein and cellular ATP levels. Electron microscopic analysis revealed that mitochondria became degenerated in cardiomyocytes that had been transduced with miR-15b and Arl2 siRNA. The present results suggest that miR-15b may decrease mitochondrial integrity by targeting Arl2 in the heart.


Figures

FIGURE 1.
FIGURE 1.
miR-15b, -16, -195, and -424 decrease cellular ATP levels. A, shown is expression of the EmGFP gene in NRVMs. B, cellular ATP levels of miR-control or individual miRNAs overexpressing NRVMs 72 h after transduction by a lentiviral vector in serum-containing medium are shown. C, structure of the mature forms of miR-15b, -16, -195, and -424 is shown. The sequence marked by asterisks is the seed sequence. D, cellular ATP levels of miR-control or miR-15b, -16, -195, and -424 overexpressing NRVMs 72 h after transduction by a lentiviral vector in serum-containing medium are shown. E and F, immunoblots of Bcl-2 (E) and cellular ATP levels (F) in NRVMs transduced with Bcl-2 siRNAs are shown. G, immunoblots of Bcl-2 in NRVMs transduced with miR-15 and -16 are shown. The bar graph indicates values expressed as relative ATP levels compared with that of miR-control (D) or scrambled siRNA (F). In D and F, data are presented as the mean ± S.E. of three independent experiments (*, p < 0.05; **, p < 0.01 versus control).
FIGURE 2.
FIGURE 2.
miR-15b targets Arl2. A and B, shown is the structure of wild-type- or mutated-Arl2 3′-UTR luciferase construct (wt/mut-Arl2–3′-UTR Luc). The mouse Arl2 3′-UTR was predicted to contain four binding sites of miR-15b, -16, -195, and -424 by TargetScanTM (A). These binding sites are highly conserved among species (B). The gray background indicates the same sequence between human, rat, and mouse. C, 293FT cells were transfected with a wt/mut-Arl2–3′-UTR Luc and expression plasmid for individual miRNAs or miR-control. (***, p < 0.001 versus wt-control; ##, p < 0.01; ###, p < 0.001 versus wt-miR) NRVMs were transduced with miR-15b or miR-control using a lentiviral vector. D and E, Arl2 mRNA and protein expression levels were detected 72 h after transduction of miR-control, -15b, or a mixture of multiple miRNAs such as miR-15b, -16, -195, and -424 (mix) by quantitative real-time-PCR (D) and immunoblotting (E), respectively. F, cellular ATP levels 72 h after transduction of the mixture or miR-control are shown. In D and F data are presented as the mean ± S.E. of three independent experiments (*, p < 0.05; **, p < 0.01 versus control).
FIGURE 3.
FIGURE 3.
miR-15b, -16, -195, and -424 have similar effects in the recognition and down-regulation of Arl2 mRNA. A, the luciferase activity is shown of Arl2 3′-UTR Luc construct in response to increasing doses of expression plasmids for individual miRNAs ranging from 0.025 to 0.2 μg. The values are luciferase activities relative to that with a dose of 0.025 μg. B, the transfection efficacy of expression plasmids for miRNAs at a dose of 0.1, 0.2, 0.4, or 0.6 μg was detected by quantitative real-time-PCR for EmGFP transduced into 293FT cells using Fugene6TM. The bar graph indicates values expressed as relative EmGFP levels compared with that with a dose of 0.2 μg (**, p < 0.01; ***, p < 0.001). C, mRNA levels are shown of Arl2 in 293FT cells 24 h after transfection with expression plasmids for individual miRNAs at a dose of 0.2 (left) and 0.4 μg (right). The values are expression levels of Arl2 mRNA relative to that of miR-control. GAPDH was used as an internal control. Data are presented as the mean ± S.E. of three independent experiments (*, p < 0.05; **, p < 0.01 versus control).
FIGURE 4.
FIGURE 4.
Down-regulation of Arl2 decreases cellular ATP levels. Assays were performed 72 h after transduction using a lentiviral vector in serum-containing medium. A and B, immunoblots of Arl2 (A) and cellular ATP levels (B) of NRVMs transduced with Arl2 siRNAs are shown. C and D, reverse transcription-PCR of BART (C) and cellular ATP levels (D) of NRVMs transduced with BART siRNAs are shown. In B and D data are presented as the mean ± S.E. of three independent experiments (*, p < 0.05; **, p < 0.01; ***, p < 0.001 versus scrambled siRNA). E–H, NRVMs stained by calcein AM (green) or ethidium homodimer (red) dyes (E and G) are shown. The bar graph indicates the proportions of live or dead cells. Lactate dehydrogenase (LDH) activity in the cultured medium was released from NRVMs (F and H). The values were standardized to the amounts of protein of the same samples. I and J show immunoblots of Arl2 (I) and cellular ATP levels (J) of NRVMs transduced with the Arl2 gene. K and L, cellular ATP levels were measured. NRVMs were co-transduced with either Arl2 gene, an empty vector, or vehicle along with miR-15b or miR-control (K) or along with either Arl2 siRNA1 or scrambled siRNA (L). The bar graph indicates values expressed as relative ATP levels compared with that with transduction with miR-control (K) or scrambled siRNA (L) along with an empty vector. Data are presented as the mean ± S.E. of four independent experiments (*, p < 0.05 versus control).
FIGURE 5.
FIGURE 5.
Loss of miR-15b, -16, -195, and -424 function increases both Arl2 gene expression and cellular ATP levels. A, the structure of “15b decoy” is shown. CMV, cytomegalovirus. B, 293FT cells were transfected with a luciferase decoy construct (Luc-15b decoys or Luc-control decoy) along with an expression plasmid for individual miRNAs or miR-control (control). C, Luc-15b decoys and Luc-control decoy were transfected into 293FT cells or NRVMs. Data are presented as the mean ± S.E. of three independent experiments (***, p < 0.001 versus Luc-control decoy). D, 293FT cells were co-transfected with Arl2–3′-UTR Luc (0.1 μg) and either miR-15b or miR-control (0.1 μg) along with increasing doses of EmGFP-15b decoy*6 (from 0.05 to 0.1 μg) using FuGENE 6TM. The bar graph indicates values expressed as relative luciferase activity compared with that with miR-control. Data are presented as the mean ± S.E. of three independent experiments (*, p < 0.05; **, p < 0.01). NRVMs were transduced with 15b decoys by a lentiviral vector in serum-containing medium. Assays were performed 24 h after transduction. Shown are immunoblots of Arl2 (E) and cellular ATP levels of NRVMs (F). In F, data are presented as the mean ± S.E. of four independent experiments (*, p < 0.05).
FIGURE 6.
FIGURE 6.
Mitochondria were degenerated by miR-15b or Arl2 siRNA in NRVMs. Shown are electron microscopy images of NRVMs 72 h after transduction with miR-control (A) or miR-15b (B) and with scrambled siRNA (C) or Arl2 siRNA1 (D) using a lentiviral vector. E–G, the size (E), degenerated proportions (F), and number/μm2 (G) of mitochondria in NRVMs are shown. Mitochondria are small, electron-dense, and deformed, and some are completely collapsed or degenerated (arrows) in the experimental groups. Bars = 200 nm. *, p < 0.05. H, ANT activities in mitochondria isolated from NRVMs transduced with miR-15b or miR-control and with Arl2 siRNA1 or scrambled siRNA are shown. The values are ADP/ATP exchange activities relative to that of miR-control or scrambled siRNA. Carboxy-atractyloside (0.5 μm) was added 1 min before the addition of external ADP.

Similar articles

Cited by

References

    1. van Rooij E., Sutherland L. B., Liu N., Williams A. H., McAnally J., Gerard R. D., Richardson J. A., Olson E. N. (2006) Proc. Natl. Acad. Sci. U.S.A. 103, 18255–18260 - PMC - PubMed
    1. Sayed D., Hong C., Chen I. Y., Lypowy J., Abdellatif M. (2007) Circ. Res. 100, 416–424 - PubMed
    1. Cheng Y., Ji R., Yue J., Yang J., Liu X., Chen H., Dean D. B., Zhang C. (2007) Am. J. Pathol. 170, 1831–1840 - PMC - PubMed
    1. Sordahl L. A., McCollum W. B., Wood W. G., Schwartz A. (1973) Am. J. Physiol. 224, 497–502 - PubMed
    1. Heyliger C. E., Ganguly P. K., Dhalla N. S. (1985) Can. J. Cardiol. 1, 401–408 - PubMed

Publication types

MeSH terms