

The mitochondrial pathway of anesthetic isoflurane-induced apoptosis
- PMID: 20007710
- PMCID: PMC2823544
- DOI: 10.1074/jbc.M109.065664
The mitochondrial pathway of anesthetic isoflurane-induced apoptosis
Abstract
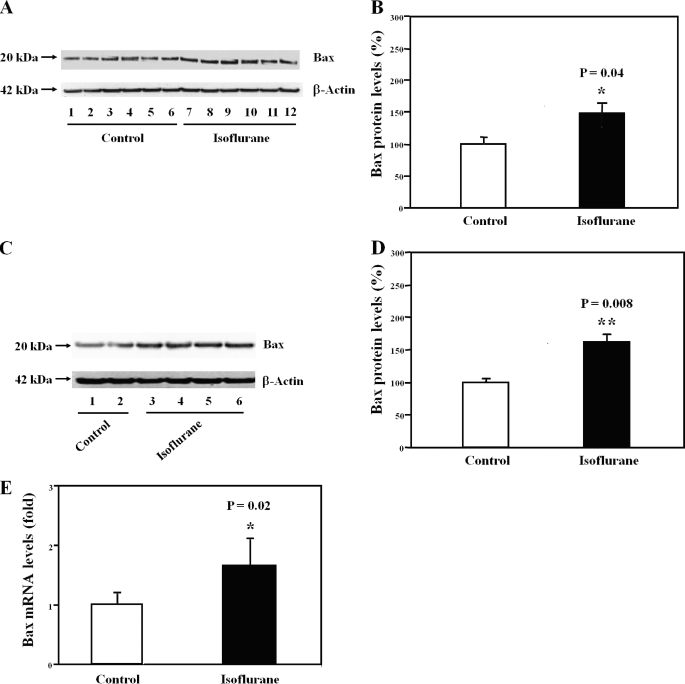
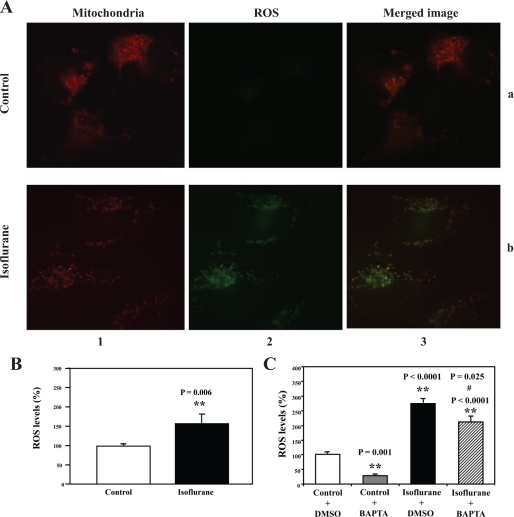
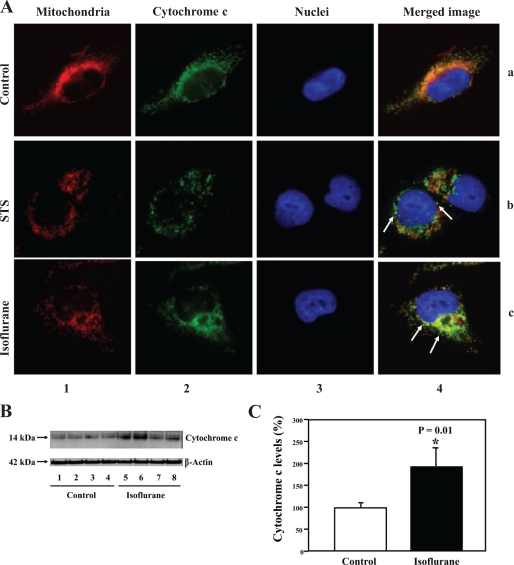
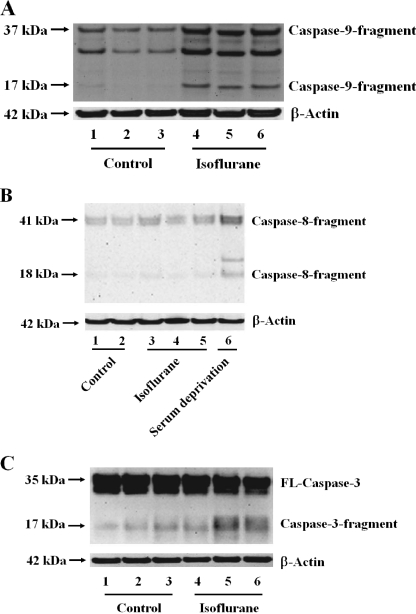
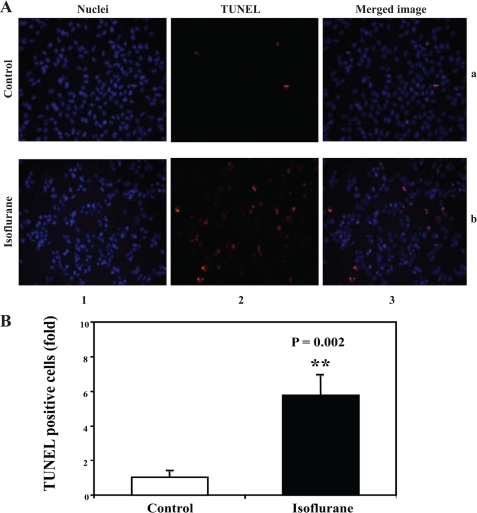
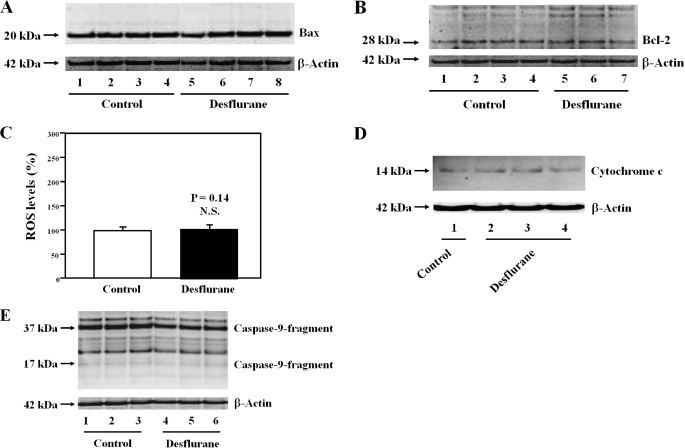
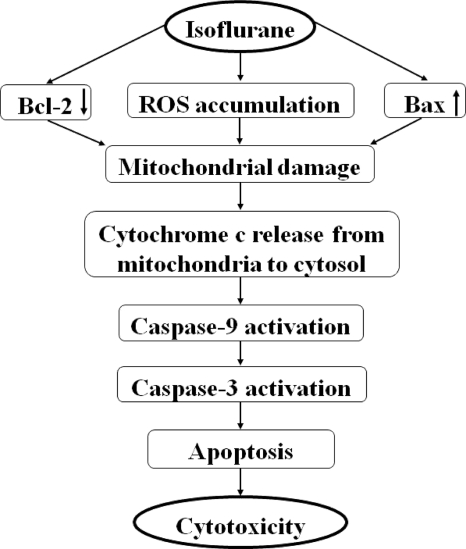
The common inhalation anesthetic isoflurane has been shown to induce apoptosis, which then leads to accumulation of beta-amyloid protein, the hallmark feature of Alzheimer disease neuropathogenesis. The underlying molecular mechanism of the isoflurane-induced apoptosis is largely unknown. We, therefore, set out to assess whether isoflurane can induce apoptosis by regulating Bcl-2 family proteins, enhancing reactive oxygen species (ROS) accumulation, and activating the mitochondrial pathway of apoptosis. We performed these studies in cultured cells, primary neurons, and mice. Here we show for the first time that treatment with 2% isoflurane for 6 h can increase pro-apoptotic factor Bax levels, decrease anti-apoptotic factor Bcl-2 levels, increase ROS accumulation, facilitate cytochrome c release from the mitochondria to the cytosol, induce activation of caspase-9 and caspase-3, and finally cause apoptosis as compared with the control condition. We have further found that isoflurane can increase the mRNA levels of Bax and reduce the mRNA levels of Bcl-2. The isoflurane-induced ROS accumulation can be attenuated by the intracellular calcium chelator BAPTA. Finally, the anesthetic desflurane does not induce activation of mitochondrial pathway of apoptosis. These results suggest that isoflurane may induce apoptosis through Bcl-2 family proteins- and ROS-associated mitochondrial pathway of apoptosis. These findings, which have identified at least partially the molecular mechanism by which isoflurane induces apoptosis, will promote more studies aimed at studying the potential neurotoxic effects of anesthetics.
Figures

Similar articles
-
Exposure of isoflurane-treated cells to hyperoxia decreases cell viability and activates the mitochondrial apoptotic pathway.Brain Res. 2016 Apr 1;1636:13-20. doi: 10.1016/j.brainres.2016.01.052. Epub 2016 Feb 5. Brain Res. 2016. PMID: 26854136
-
Isoflurane preconditioning increases B-cell lymphoma-2 expression and reduces cytochrome c release from the mitochondria in the ischemic penumbra of rat brain.Eur J Pharmacol. 2008 May 31;586(1-3):106-13. doi: 10.1016/j.ejphar.2008.02.073. Epub 2008 Feb 29. Eur J Pharmacol. 2008. PMID: 18355806 Free PMC article.
-
Lanthanum induced primary neuronal apoptosis through mitochondrial dysfunction modulated by Ca²⁺ and Bcl-2 family.Biol Trace Elem Res. 2013 Apr;152(1):125-34. doi: 10.1007/s12011-013-9601-3. Epub 2013 Jan 23. Biol Trace Elem Res. 2013. PMID: 23338853
-
Inhibition of mitochondrial neural cell death pathways by protein transduction of Bcl-2 family proteins.J Bioenerg Biomembr. 2005 Jun;37(3):179-90. doi: 10.1007/s10863-005-6590-8. J Bioenerg Biomembr. 2005. PMID: 16167175 Free PMC article. Review.
-
Redox regulation of the intrinsic pathway in neuronal apoptosis.Antioxid Redox Signal. 2011 Apr 15;14(8):1437-48. doi: 10.1089/ars.2010.3596. Epub 2011 Jan 8. Antioxid Redox Signal. 2011. PMID: 20812874 Free PMC article. Review.
Cited by
-
Carbon monoxide modulates cytochrome oxidase activity and oxidative stress in the developing murine brain during isoflurane exposure.Free Radic Biol Med. 2015 Sep;86:191-9. doi: 10.1016/j.freeradbiomed.2015.05.029. Epub 2015 May 29. Free Radic Biol Med. 2015. PMID: 26032170 Free PMC article.
-
Desoxyrhapontigenin attenuates neuronal apoptosis in an isoflurane-induced neuronal injury model by modulating the TLR-4/cyclin B1/Sirt-1 pathway.AMB Express. 2020 Sep 30;10(1):175. doi: 10.1186/s13568-020-01105-4. AMB Express. 2020. PMID: 32997222 Free PMC article.
-
Perioperative Neurocognitive Disorder: State of the Preclinical Science.Anesthesiology. 2020 Jan;132(1):55-68. doi: 10.1097/ALN.0000000000002956. Anesthesiology. 2020. PMID: 31834869 Free PMC article. Review.
-
Anesthetic sevoflurane reduces levels of hippocalcin and postsynaptic density protein 95.Mol Neurobiol. 2015;51(3):853-63. doi: 10.1007/s12035-014-8746-1. Epub 2014 May 29. Mol Neurobiol. 2015. PMID: 24870966
-
Elamipretide (SS-31) Ameliorates Isoflurane-Induced Long-Term Impairments of Mitochondrial Morphogenesis and Cognition in Developing Rats.Front Cell Neurosci. 2017 Apr 25;11:119. doi: 10.3389/fncel.2017.00119. eCollection 2017. Front Cell Neurosci. 2017. PMID: 28487636 Free PMC article.
References
-
- Bohnen N., Warner M. A., Kokmen E., Kurland L. T. (1994) Int. J. Neurosci. 77, 181–185 - PubMed
-
- Lee T. A., Wolozin B., Weiss K. B., Bednar M. M. (2005) J. Alzheimers Dis. 7, 319–324 - PubMed
-
- Bufill E., Bartés A., Moral A., Casadevall T., Codinachs M., Zapater E., Carles Rovira J., Roura P., Oliva R., Blesa R. (2009) Neurologia 24, 108–112 - PubMed
-
- Knopman D. S., Petersen R. C., Cha R. H., Edland S. D., Rocca W. A. (2005) Neurology 65, 986–990 - PubMed
-
- Gasparini M., Vanacore N., Schiaffini C., Brusa L., Panella M., Talarico G., Bruno G., Meco G., Lenzi G. L. (2002) Neurol. Sci. 23, 11–14 - PubMed
Publication types
MeSH terms
Substances
Grants and funding
LinkOut - more resources
Full Text Sources
Research Materials
