. 2010 Feb 12;285(7):5066-75.
doi: 10.1074/jbc.M109.072736. Epub 2009 Dec 10.

The intracellular loop of Orai1 plays a central role in fast inactivation of Ca2+ release-activated Ca2+ channels

Affiliations

The intracellular loop of Orai1 plays a central role in fast inactivation of Ca2+ release-activated Ca2+ channels

Sonal Srikanth et al. J Biol Chem. .

Abstract

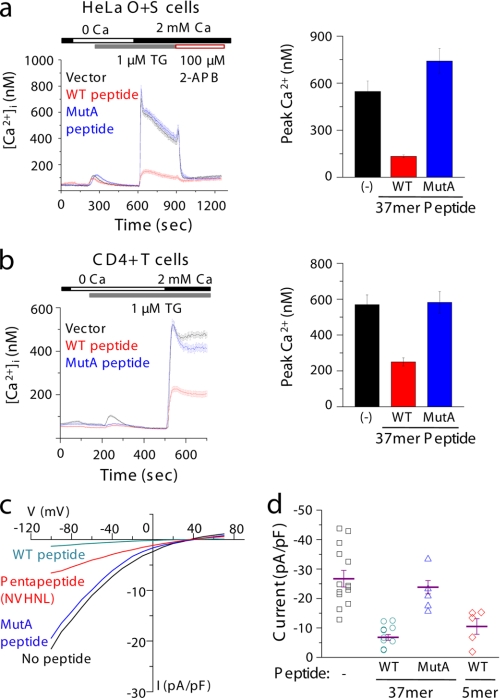
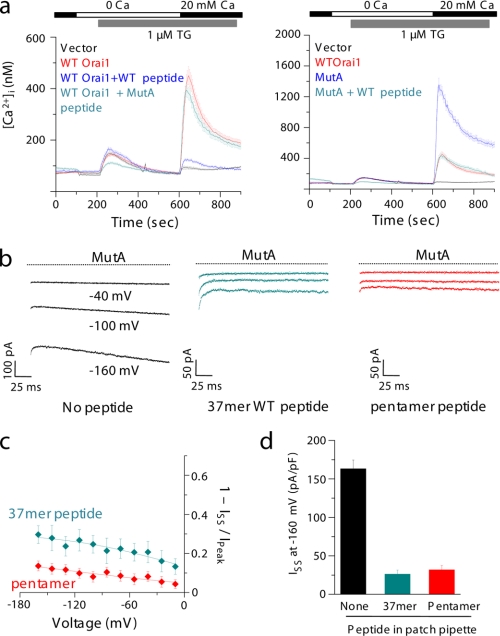
Store-operated Ca(2+) entry (SOCE) due to activation of Ca(2+) release-activated Ca(2+) (CRAC) channels leads to sustained elevation of cytoplasmic Ca(2+) and activation of lymphocytes. CRAC channels consisting of four pore-forming Orai1 subunits are activated by STIM1, an endoplasmic reticulum Ca(2+) sensor that senses intracellular store depletion and migrates to plasma membrane proximal regions to mediate SOCE. One of the fundamental properties of CRAC channels is their Ca(2+)-dependent fast inactivation. To identify the domains of Orai1 involved in fast inactivation, we have mutated residues in the Orai1 intracellular loop linking transmembrane segment II to III. Mutation of four residues, V(151)SNV(154), at the center of the loop (MutA) abrogated fast inactivation, leading to increased SOCE as well as higher CRAC currents. Point mutation analysis identified five key amino acids, N(153)VHNL(157), that increased SOCE in Orai1 null murine embryonic fibroblasts. Expression or direct application of a peptide comprising the entire intracellular loop or the sequence N(153)VHNL(157) blocked CRAC currents from both wild type (WT) and MutA Orai1. A peptide incorporating the MutA mutations had no blocking effect. Concatenated Orai1 constructs with four MutA monomers exhibited high CRAC currents lacking fast inactivation. Reintroduction of a single WT monomer (MutA-MutA-MutA-WT) was sufficient to fully restore fast inactivation, suggesting that only a single intracellular loop can block the channel. These data suggest that the intracellular loop of Orai1 acts as an inactivation particle, which is stabilized in the ion permeation pathway by the N(153)VHNL(157) residues. These results along with recent reports support a model in which the N terminus and the selectivity filter of Orai1 as well as STIM1 act in concert to regulate the movement of the intracellular loop and evoke fast inactivation.


Figures

FIGURE 1.
FIGURE 1.
Mutational analysis of the Orai1 intracellular loop between TM II and III. a, alignment of the intracellular loop, including part of TM II and TM III of human Orai1, -2, and -3 and Drosophila Orai (dOrai). Residues labeled in blue identify mutations tested in this loop. MutA, MutB, and MutC represent groups of four amino acids mutated to alanine (boxed residues). b, SOCE induced in Orai1-null MEFs by retroviral expression of WT and mutant Orai1 proteins. Intracellular Ca2+ stores were first depleted by a SERCA blocker, thapsigargin (TG; 1 μm), and then SOCE was measured by the addition of 20 mm external Ca2+. Each trace represents an average from 30–60 cells. The left panel shows representative Ca2+ entry traces obtained with groups of four mutants, whereas the right panel shows traces with single-point mutants of Orai1. c, peak [Ca2+]i was estimated for each mutant following store depletion. The bar graph shows the average and S.E. values from at least three independent experiments. The five amino acids, N153VHNL157, that increase SOCE upon mutation are labeled in red. Amino acid residues that abrogate SOCE upon mutation have been underlined (Pro146, Glu149, and Pro164). d, reconstitution of SOCE in Orai1-null CD4+ T cells. WT and MutA Orai1 cDNAs were expressed in Orai1-deficient primary T cells using a retroviral vector, expressing GFP from an internal ribosomal entry site (IRES). SOCE was measured using ratiometric Ca2+ imaging after intracellular store depletion using thapsigargin (left) or anti-CD3 antibodies (right). The bar graph on the far right shows average peak [Ca2+]i from three independent experiments using thapsigargin.
FIGURE 2.
FIGURE 2.
MutA Orai1 shows increased CRAC currents due to loss of fast Ca2+-dependent inactivation. a, CRAC currents in HEK293 cells expressing WT or MutA Orai1 together with STIM1 (molar ratio of 1:1). The left panel shows representative raw current traces obtained with voltage steps of 300 ms starting at −100 mV and up to 0 mV (20-mV intervals) from a holding potential of 0 mV. The right panel shows inwardly rectifying I-V curves typical of CRAC channels from cells expressing either WT (black trace) or MutA (red trace) Orai1. For these experiments, the intracellular pipette solution contained 12 mm EGTA, and the external solution contained 2 mm CaCl2. b, fast Ca2+-dependent inactivation of WT or MutA Orai1 monomers. HEK293 cells expressing WT (left, black traces) or MutA (right, red traces) Orai1 along with STIM1 (1:1 molar ratio) were perfused with extracellular solution containing 110 mm CaCl2. WT Orai1 showed strong fast inactivation at hyperpolarizing voltages, whereas MutA Orai1 showed a complete lack of fast inactivation. Two exponentials were required to fit the WT traces (red lines), yielding time constants of 3.3 ± 0.39 and 35 ± 5.4 ms. c, Ca2+ dependence (measured as apparent voltage dependence) of fast inactivation. The extent of inactivation or percentage inhibition, estimated as 1 − Iss/Ip, is plotted as a function of voltage for WT (black trace) as well as MutA (red trace) Orai1 channels. d, steady state currents from WT or MutA Orai1 channels. The data show average steady state currents from HEK293 cells expressing WT or MutA Orai1 channels (same as in b) in extracellular solution containing 110 mm CaCl2. Each bar represents an average of 10–12 cells.
FIGURE 3.
FIGURE 3.
Exogenous expression of intracellular loop between TM II and TM III of Orai1 blocks CRAC currents from WT Orai1. a, expression of peptide derived from WT intracellular loop blocks SOCE in HeLa cells stably expressing Orai1 and STIM1. Left, HeLa cells stably expressing Orai1 and STIM1 (HeLa O+S cells) were transfected with plasmids encoding 37-mer peptide corresponding to WT intracellular loop (WT peptide; red trace) or MutA intracellular loop (MutA peptide; blue trace). SOCE measured in cells transfected with the empty vector is shown in black. Expression of WT but not MutA peptide blocks SOCE after thapsigargin-induced intracellular Ca2+ store depletion. The plot shows average peak [Ca2+]i values from three independent experiments. 40–60 GFP-positive cells were selected for analysis from each experiment. b, expression of WT intracellular peptide blocks native CRAC channels in primary CD4+ T cells. Primary CD4+ T cells were transduced with retrovirus encoding either empty vector (black trace) or WT (red trace) or MutA (blue trace) peptides. Average peak [Ca2+]i values from three independent experiments are depicted in the bar graph. 50–100 GFP-positive cells were selected for analysis. c, inhibition of CRAC currents by WT peptide. Whole-cell patch clamp experiments were carried out with HeLa O+S cells. Currents were recorded with pipette solution containing 12 mm EGTA and an external solution containing 6 mm Ca2+. Residual currents measured after treatment with 100 μm 2-aminoethoxydeiphenyl borate were subtracted from the total currents, yielding inwardly rectifying CRAC currents. For peptide inhibition, currents were recorded with a 50 μm concentration of either WT 37-mer, MutA 37-mer, or WT 5-mer synthetic peptides added to the pipette solution. The black traces are from control cells in the absence of any peptide in the intracellular solution. The cyan and red traces show inhibited CRAC currents with WT 37-mer and WT 5-mer peptides, respectively, whereas the blue trace represents CRAC currents with MutA 37-mer peptide in the patch pipette. d, normalized peak currents from HeLa O+S cells in the presence of peptides in the intracellular solution. Recording conditions and solutions were same as shown for c. Each symbol represents the peak current from an individual cell 5 min after gaining access to the intracellular milieu.
FIGURE 4.
FIGURE 4.
Overexpression of intracellular loop between TM II and TM III of Orai1 blocks CRAC currents from MutA Orai1. a, inhibition of MutA-mediated increase in SOCE by co-expression of WT peptide. Shown are Orai1 knock-out MEFs stably expressing either WT or MutA 37-mer peptides in the presence of WT Orai1 (left) or MutA Orai1 (right). WT but not MutA peptide blocks SOCE after thapsigargin-induced intracellular Ca2+ store depletion. Each trace represents an average from 30–50 GFP-positive cells. b, inhibition of MutA derived CRAC currents by WT peptide. Whole-cell patch clamp experiments were carried out with HEK293 cells expressing MutA Orai1 along with STIM1 (1:1 molar ratio). Currents were recorded with pipette solution containing 12 mm EGTA and 110 mm Ca2+ in the bath solution. Where indicated, a 50 μm concentration of either WT 37-mer peptide (cyan trace) or WT 5-mer peptide (red trace) was added to the pipette solution. The black traces represent currents from cells expressing MutA Orai1 in the absence of any peptide in the intracellular solution. The currents in the presence of WT 37-mer peptide are fitted by two exponentials (black lines). c, plot of percentage inhibition (1 − Iss/Ip) as a function of voltage. The extent of inactivation or percentage inhibition estimated as 1 − Iss/Ip is plotted as a function of voltage for MutA Orai1 in the presence of 37-mer (cyan trace) or 5-mer (red trace) peptide. d, steady state currents from MutA Orai1 channels in the absence or presence of peptides. Data show average steady state currents at −160 mV from HEK293 cells expressing MutA Orai1 channels (same as in b) in extracellular solution containing 110 mm CaCl2. Each bar represents an average of 4–6 cells.
FIGURE 5.
FIGURE 5.
In concatenated Orai1 tetramers, a single WT intracellular loop restores fast Ca2+-dependent inactivation. a, schematic showing concatenated Orai1 tetramers with zero (4 MutA), one, two, three, or four WT inactivation particles. MutA monomers are depicted in red. b, measurement of SOCE in Orai1-null MEFs expressing concatenated tetramers with different stoichiometry of WT and MutA subunits. Store-operated Ca2+ entry was measured in Orai1-null MEFs stably expressing either empty vector or concatenated Orai1 tetramers comprising zero, one, two, or three WT inactivation particles. The bar graph (right) shows averages of peak [Ca2+]i from at least three independent experiments. Each trace represents an average from 30–50 GFP-positive cells. c, measurement of CRAC currents from HEK293 cells expressing STIM1 and various tetramers of Orai1 (molar ratio of 1:1). Whole-cell currents were recorded with pipette solution containing 12 mm EGTA and an external solution containing 110 mm Ca2+. The traces show currents obtained with WT tetramer (blue), MutA tetramer (red), and 3MutA1WT tetramer (cyan). The individual traces for WT and 3MutA1WT tetramers are fit by two exponentials (black lines). d, Ca2+-dependent fast inactivation in concatenated Orai1 tetramers. The extent of inactivation (1 − Iss/Ip) is plotted as a function of voltage for tetramers comprising four WT subunits (blue), one WT and three MutA subunits (cyan), or four MutA subunits (red). e, steady state currents from concatenated Orai1 tetramers. Data show the average (and S.E.) steady state currents at −160 mV from HEK293 cells expressing tetramers of Orai1 with either four, zero, or one WT monomer (same as in b) in extracellular solution containing 110 mm CaCl2. Each bar represents an average of 4–6 cells.

References

    1. Cahalan M. D. (2009) Nat. Cell Biol. 11, 669–677 - PMC - PubMed
    1. Feske S. (2007) Nat. Rev. Immunol. 7, 690–702 - PubMed
    1. Hogan P. G., Chen L., Nardone J., Rao A. (2003) Genes Dev. 17, 2205–2232 - PubMed
    1. Lewis R. S. (2001) Annu. Rev. Immunol. 19, 497–521 - PubMed
    1. Putney J. W., Jr. (1986) Cell Calcium 7, 1–12 - PubMed

Publication types