. 2010 Feb 12;285(7):4747-56.
doi: 10.1074/jbc.M109.068098. Epub 2009 Dec 10.

Structural basis for translation factor recruitment to the eukaryotic/archaeal ribosomes

Affiliations

Structural basis for translation factor recruitment to the eukaryotic/archaeal ribosomes

Takao Naganuma et al. J Biol Chem. .

Abstract

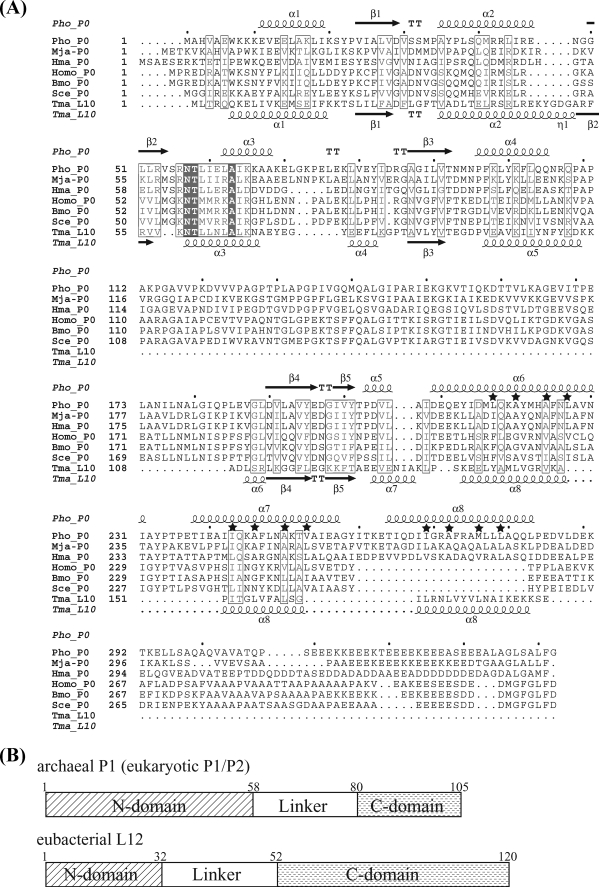
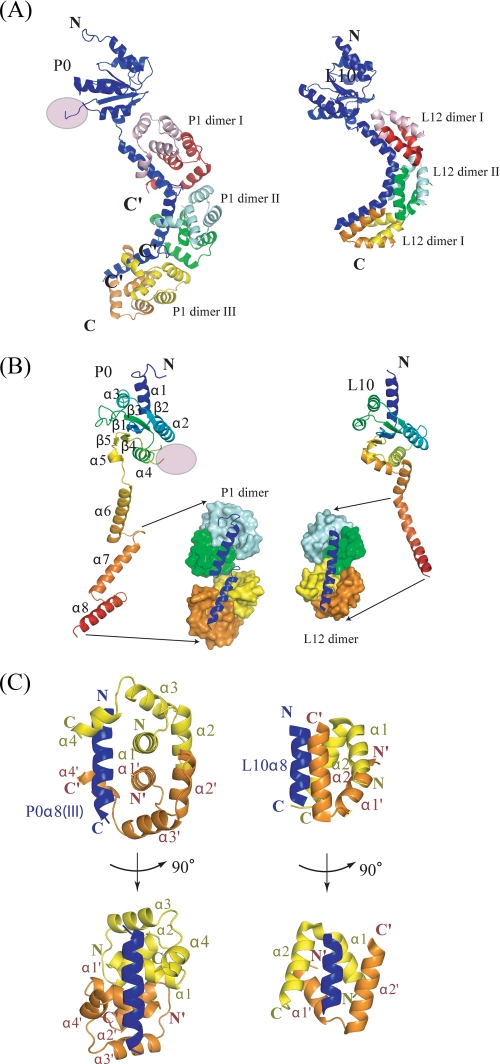
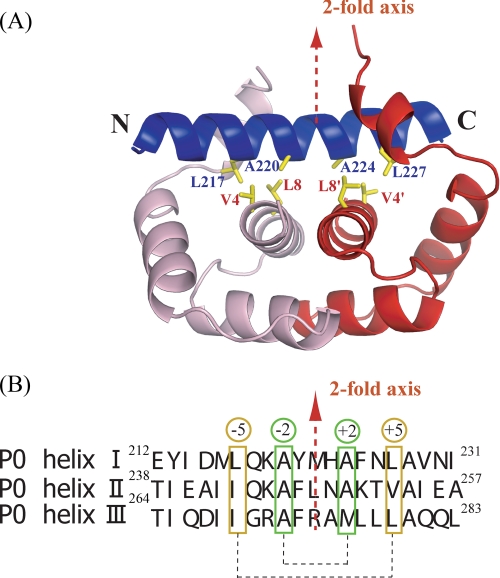
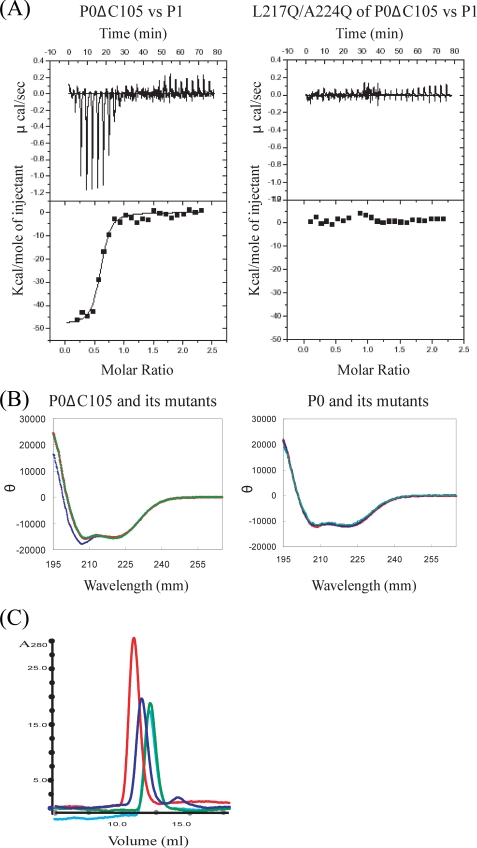
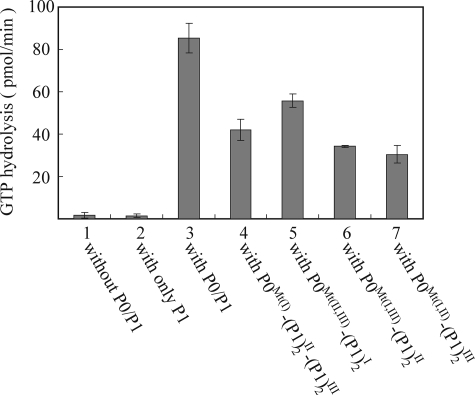
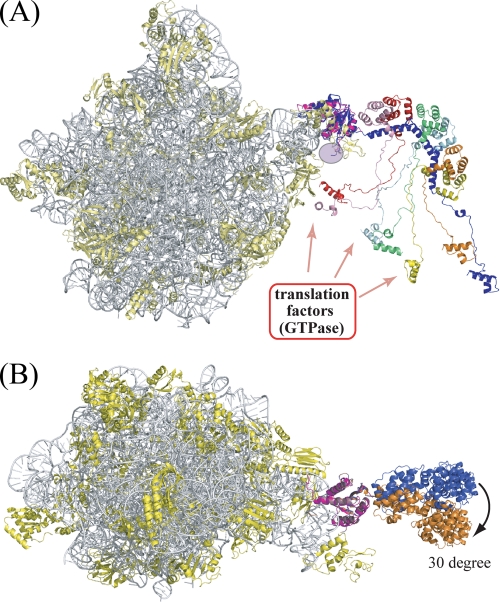
The archaeal ribosomal stalk complex has been shown to have an apparently conserved functional structure with eukaryotic pentameric stalk complex; it provides access to eukaryotic elongation factors at levels comparable to that of the eukaryotic stalk. The crystal structure of the archaeal heptameric (P0(P1)(2)(P1)(2)(P1)(2)) stalk complex shows that the rRNA anchor protein P0 consists of an N-terminal rRNA-anchoring domain followed by three separated spine helices on which three P1 dimers bind. Based on the structure, we have generated P0 mutants depleted of any binding site(s) for P1 dimer(s). Factor-dependent GTPase assay of such mutants suggested that the first P1 dimer has higher activity than the others. Furthermore, we constructed a model of the archaeal 50 S with stalk complex by superposing the rRNA-anchoring domain of P0 on the archaeal 50 S. This model indicates that the C termini of P1 dimers where translation factors bind are all localized to the region between the stalk base of the 50 S and P0 spine helices. Together with the mutational experiments we infer that the functional significance of multiple copies of P1 is in creating a factor pool within a limited space near the stalk base of the ribosome.


Figures

FIGURE 1.
FIGURE 1.
Sequence comparison of the stalk complexes. A, sequence alignment of archaeal/eukaryotic P0 and eubacterial L10. This alignment was prepared using Web service of ClustalW and modified based on the structural comparison of Pho_P0 and Tma_L10. Pho, P. horikoshii OT3; Mja, Methanocaldococcus jannaschii DSM 2661; Hma, H. marismortui; Homo, Homo sapiens; Bmo, Bombyx mori; Sce, S. cerevisiae; and Tma, Thermotoga maritima. The secondary structures of archaeal P0 and eubacterial L10 are indicated above and below the sequences, respectively. The α-helices and β-strands are represented as helices and arrows, respectively, and β-turns are marked TT. Hydrophobic residues important for P1 binding are marked by stars. The figure was prepared using ESPript (available on-line). B, schematic representation of domain organization of archaeal P1, eukaryotic P1/P2, and eubacterial L12 (E. coli).
FIGURE 2.
FIGURE 2.
Structural comparison between archaeal (left) and eubacterial (right) stalk complex. A, ribbon representation of the overall structure of the archaeal (left) and eubacterial (right) stalk complex showing the N-domain at the top. The disordered insertion region is shown as a pink circle. P0 (or L10) is colored blue, while three P1 (or L12) dimers bound to the spine helices are colored pink/red, cyan/green, and yellow/orange, respectively. The truncated C termini of all P1 dimers are indicated by C′. B, rainbow representation of P0 (left) and L10 (right) showing their N-terminal domains have a similar fold except for the disordered insertion region. P1 dimers (or L12 dimers) bound to the second and third spine helices (the first are not depicted for clarity) are shown as a space-filling model. C, orthogonal view of the interactions between P0 and P1 dimer (left), and L10 and L12 dimer (right). The secondary structures are labeled in the same color as in the structure, where the prime symbol refers to the second monomer. All structure figures were prepared with the program PyMOL (DeLano Scientific LLC, San Carlos, CA).
FIGURE 3.
FIGURE 3.
Interactions between P0 spine helix and P1 dimer. A, close-up view of P0 spine helix I (blue) and first P1 dimer (pink/red). The hydrophobic residues important for binding are shown as sticks. The 2-fold axis of the P1 dimer is shown as a red broken line. B, the sequences of three spine helices. The hydrophobic residues important for the binding of P1 dimers are marked in green and orange boxes. They are positioned at ±2 and ±5 from the 2-fold dimer axis.
FIGURE 4.
FIGURE 4.
The isothermal titration calorimetry measurement, CD spectra, and gel-filtration experiment. A, representative plots from isothermal titration calorimetry experiments of interaction between P0 mutants and P1 at 70 °C are illustrated with raw data in the upper panel and fitting curves (continuous lines) in the lower panel. The concentrations of P0 mutants and P1 dimer were 0.0085 and 0.1 mm, respectively. B, CD spectrum of P0DC105, double mutation variant L217Q/A224Q of P0ΔC105 and quadruple mutation variant L217Q/A220Q/A224Q/L227Q of P0ΔC105 are shown as red, green, and blue lines, respectively (left). CD spectrum of P0, mutation variant P0Mt(I, II) and P0Mt(I, III) are shown as red, green, and blue lines, respectively (right). C, the result of the gel-filtration experiment for stalk complexes. The plots of P0(P1)2(P1)2(P1)2, P0Mt(I)(P1)2II(P1)2IIII, P0Mt(I, III)(P1)2II, and P0Mt(I, II)(P1)2III are shown as red, blue, light blue, and green lines, respectively.
FIGURE 5.
FIGURE 5.
Contribution of individual P1 stalk dimers to eEF2-dependent GTPase activity. E. coli 50 S core (2.5 pmol) was preincubated without P0/P1 (column 1) or with only P1 (80 pmol) (column 2). The same core was also incubated with 10 pmol of the following complexes: column 3, intact P0(P1)2I(P1)2II(P1)2III complex reconstituted from purified P0 and P1; column 4, the complex formed with the P0 mutant (L217Q/A224Q), P0Wt(I)(P1)2II(P1)2III; column 5, the complex formed with the P0 mutant (I243Q/A250Q/A272Q/L279Q), P0Wt(II,III)(P1)2I; column 6, the complex with the P0 mutant (L217Q/A224Q/A272Q/L279Q), P0Wt(I,III)(P1)2II; column 7, the complex formed with the P0 mutant (L217Q/A224Q/I243Q/A250Q), P0Wt(I,II)(P1)2III. These hybrid samples were then assayed for eukaryotic eEF2-dependent GTPase activity in the presence of PhL11 and E. coli 30 S subunits (7.5 pmol). The superscripts of P1 indicate the bound position on spine of P0.
FIGURE 6.
FIGURE 6.
Stalk complex model superposed on the H. marismortui 50 S subunit. The 23 S rRNA and ribosomal proteins of the H. marismortui 50 S subunit (PDB ID: 2QA4) are indicated as gray and yellow ribbons, respectively, while the N-terminal domain of HmP0 is colored purple. A, a side view of the 50 S ribosome carrying the stalk complex. The stalk complex is colored as in Fig. 2A. This figure includes all the truncated C-terminal parts of P0 and P1 to emphasize that they are all in a limited space near the stalk base of the ribosome (see “Discussion”). B, top view of the 50 S subunit carrying stalk complex in two positions. The stalk complex colored blue is the same model as in A, whereas the stalk complex colored orange is a model that fits into the residual electron density of the H. marismortui 50 S subunit.
FIGURE 7.
FIGURE 7.
Functional contributions of the C-terminal regions of P1/P0 and of the insertion domain of P0. A, effects of the truncation mutations of the stalk complex on eEF2-dependent GTPase. E. coli 50 S core (2.5 pmol) was preincubated without stalk complex (column 1) or with 20 pmol of the following complexes: column 2, P0–P1 (P0: wild type; P1: wild-type); column 3, P0–P1ΔC50; column 4, P0ΔC58-P1; column 5, P0ΔC58-P1ΔC50; column 6, P0(Δ111–180)-P1; and column 7, P0(Δ111–180)ΔC58-P1ΔC50. The resultant particles were then assayed for eukaryotic eEF2-dependent GTPase activity in the presence of PhL11 (7.5 pmol) and E. coli 30 S subunits (7.5 pmol). B, the same samples (10 pmol of core) as in A were assayed for eukaryotic eEF1α- and eEF2-dependent poly(U)-directed polyphenylalanine synthesis in the hybrid ribosome system (42). C, effects of the truncation mutations of the stalk complex on eEF2 binding. E. coli 50 S core (30 pmol) was preincubated without any stalk complex (lane 1) or with 120 pmol of the following complexes: lane 2, P0–P1; lane 3, P0–P1ΔC50; lane 4, P0ΔC58-P1; lane 5, P0ΔC58-P1ΔC50; lane 6, P0(Δ111–180)-P1; and lane 7, P0(Δ111–180)ΔC58-P1ΔC50. The resultant particles were then incubated with eukaryotic eEF2 (lane 8, eEF2 alone) and GMPPNP, together with PhL11 (90 pmol) and E. coli 30 S subunits (90 pmol), and the eEF2·ribosome complexes were recovered by ultracentrifugation. A given amount of each complex was analyzed by SDS-PAGE. The gels were stained with Coomassie Brilliant Blue.

Similar articles

Cited by

References

    1. Möller W., Maassen J. A. (1986) in Structure, Function, and Genetics of Ribosomes (Hardesty B., Kramer G. eds) pp. 309–325, Springer-Verlag New York Inc., New York
    1. Chandra Sanyal S., Liljas A. (2000) Curr. Opin. Struct. Biol. 10, 633–636 - PubMed
    1. Traut R. R., Dey D., Bochkariov D. E., Oleinikov A. V., Jokhadze G. G., Hamman B., Jameson D. (1995) Biochem. Cell Biol. 73, 949–958 - PubMed
    1. Gudkov A. T. (1997) FEBS Lett. 407, 253–256 - PubMed
    1. Bocharov E. V., Sobol A. G., Pavlov K. V., Korzhnev D. M., Jaravine V. A., Gudkov A. T., Arseniev A. S. (2004) J. Biol. Chem. 279, 17697–17706 - PubMed

Publication types

Substances

Associated data

LinkOut - more resources