Cholecalciferol supplementation alters calcitriol-responsive monocyte proteins and decreases inflammatory cytokines in ESRD
- PMID: 20007751
- PMCID: PMC2834546
- DOI: 10.1681/ASN.2009040451
Cholecalciferol supplementation alters calcitriol-responsive monocyte proteins and decreases inflammatory cytokines in ESRD
Abstract
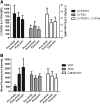
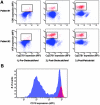
In vitro, monocyte 1alpha-hydroxylase converts 25-hydroxyvitamin D [25(OH)D] to 1,25-dihydroxyvitamin D to regulate local innate immune responses, but whether 25(OH)D repletion affects vitamin D-responsive monocyte pathways in vivo is unknown. Here, we identified seven patients who had 25(OH)D insufficiency and were undergoing long-term hemodialysis and assessed changes after cholecalciferol and paricalcitol therapies in both vitamin D-responsive proteins in circulating monocytes and serum levels of inflammatory cytokines. Cholecalciferol therapy increased serum 25(OH)D levels four-fold, monocyte vitamin D receptor expression three-fold, and 24-hydroxylase expression; therapy decreased monocyte 1alpha-hydroxylase levels. The CD16(+) "inflammatory" monocyte subset responded to 25(OH)D repletion the most, demonstrating the greatest increase in vitamin D receptor expression after cholecalciferol. Cholecalciferol therapy reduced circulating levels of inflammatory cytokines, including IL-8, IL-6, and TNF. These data suggest that nutritional vitamin D therapy has a biologic effect on circulating monocytes and associated inflammatory markers in patients with ESRD.
Figures


Similar articles
-
T-cell cytokines differentially control human monocyte antimicrobial responses by regulating vitamin D metabolism.Proc Natl Acad Sci U S A. 2010 Dec 28;107(52):22593-8. doi: 10.1073/pnas.1011624108. Epub 2010 Dec 13. Proc Natl Acad Sci U S A. 2010. PMID: 21149724 Free PMC article.
-
Effect of cholecalciferol on vitamin D-regulatory proteins in monocytes and on inflammatory markers in dialysis patients: A randomized controlled trial.Clin Nutr. 2016 Dec;35(6):1251-1258. doi: 10.1016/j.clnu.2016.04.014. Epub 2016 Apr 26. Clin Nutr. 2016. PMID: 27161894 Clinical Trial.
-
Vitamin D Status in Chronic Kidney Disease - UVB Irradiation Is Superior to Oral Supplementation.Anticancer Res. 2016 Mar;36(3):1397-401. Anticancer Res. 2016. PMID: 26977042
-
Expanding role for vitamin D in chronic kidney disease: importance of blood 25-OH-D levels and extra-renal 1alpha-hydroxylase in the classical and nonclassical actions of 1alpha,25-dihydroxyvitamin D(3).Semin Dial. 2007 Jul-Aug;20(4):316-24. doi: 10.1111/j.1525-139X.2007.00302.x. Semin Dial. 2007. PMID: 17635821 Review.
-
Vitamin D metabolism and action in the prostate: implications for health and disease.Mol Cell Endocrinol. 2011 Dec 5;347(1-2):61-9. doi: 10.1016/j.mce.2011.05.010. Epub 2011 Jun 1. Mol Cell Endocrinol. 2011. PMID: 21664249 Free PMC article. Review.
Cited by
-
The immunoregulatory function of vitamin D: implications in chronic kidney disease.Nat Rev Nephrol. 2012 May 22;8(7):403-12. doi: 10.1038/nrneph.2012.93. Nat Rev Nephrol. 2012. PMID: 22614789 Review.
-
Old and New Drugs for the Management of Bone Disorders in CKD.Calcif Tissue Int. 2021 Apr;108(4):486-495. doi: 10.1007/s00223-020-00788-y. Epub 2021 Jan 2. Calcif Tissue Int. 2021. PMID: 33386480 Review.
-
Nutritional insights into pulmonary fibrosis: a comprehensive review on the impact of vitamins.Front Nutr. 2025 Apr 11;12:1525408. doi: 10.3389/fnut.2025.1525408. eCollection 2025. Front Nutr. 2025. PMID: 40290659 Free PMC article. Review.
-
Serum vitamin D levels and acute kidney injury: a systemic review and meta-analysis.Sci Rep. 2022 Nov 27;12(1):20365. doi: 10.1038/s41598-022-24560-4. Sci Rep. 2022. PMID: 36437252 Free PMC article.
-
Vitamin D supplementation in pre-dialysis chronic kidney disease: A systematic review.Dermatoendocrinol. 2012 Apr 1;4(2):118-27. doi: 10.4161/derm.20014. Dermatoendocrinol. 2012. PMID: 22928067 Free PMC article.
References
-
- Jones G, Strugnell SA, DeLuca HF: Current understanding of the molecular actions of vitamin D. Physiol Rev 78: 1193–1231, 1998 - PubMed
-
- Zisman AL, Hristova M, Ho LT, Sprague SM: Impact of ergocalciferol treatment of vitamin D deficiency on serum parathyroid hormone concentrations in chronic kidney disease. Am J Nephrol 27: 36–43, 2007 - PubMed
-
- Al-Aly Z, Qazi RA, Gonzalez EA, Zeringue A, Martin KJ: Changes in serum 25-hydroxyvitamin D and plasma intact PTH levels following treatment with ergocalciferol in patients with CKD. Am J Kidney Dis 50: 59–68, 2007 - PubMed
-
- Saab G, Young DO, Gincherman Y, Giles K, Norwood K, Coyne DW: Prevalence of vitamin D deficiency and the safety and effectiveness of monthly ergocalciferol in hemodialysis patients. Nephron Clin Pract 105: c132–c138, 2007 - PubMed
-
- Briese S, Wiesner S, Will JC, Lembcke A, Opgen-Rhein B, Nissel R, Wernecke KD, Andreae J, Haffner D, Querfeld U: Arterial and cardiac disease in young adults with childhood-onset end-stage renal disease: Impact of calcium and vitamin D therapy. Nephrol Dial Transplant 21: 1906–1914, 2006 - PubMed
Publication types
MeSH terms
Substances
Grants and funding
LinkOut - more resources
Full Text Sources
Other Literature Sources
Medical

