. 2009 Dec 29;106(52):22293-8.
doi: 10.1073/pnas.0907781106. Epub 2009 Dec 10.

Alterations of the Notch pathway in lung cancer

Affiliations

Alterations of the Notch pathway in lung cancer

Britta Westhoff et al. Proc Natl Acad Sci U S A. .

Abstract

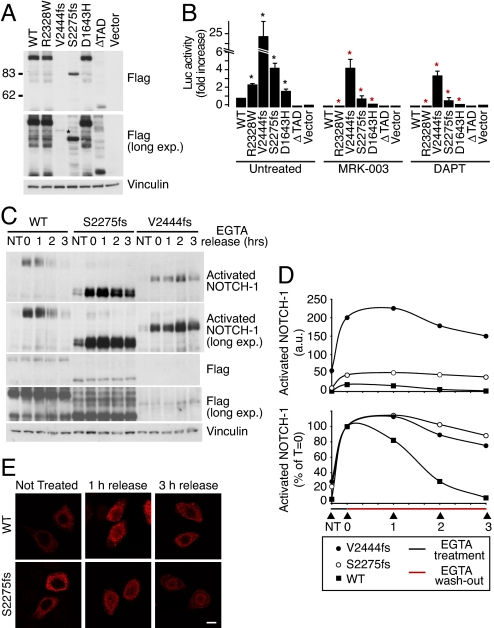
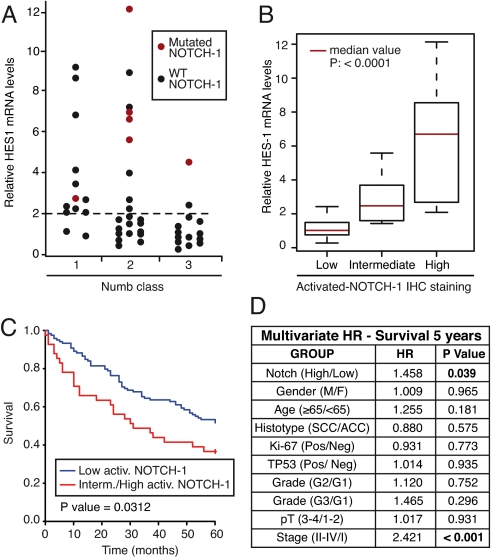
Notch signaling regulates cell specification and homeostasis of stem cell compartments, and it is counteracted by the cell fate determinant Numb. Both Numb and Notch have been implicated in human tumors. Here, we show that Notch signaling is altered in approximately one third of non-small-cell lung carcinomas (NSCLCs), which are the leading cause of cancer-related deaths: in approximately 30% of NSCLCs, loss of Numb expression leads to increased Notch activity, while in a smaller fraction of cases (around 10%), gain-of-function mutations of the NOTCH-1 gene are present. Activation of Notch correlates with poor clinical outcomes in NSCLC patients without TP53 mutations. Finally, primary epithelial cell cultures, derived from NSCLC harboring constitutive activation of the Notch pathway, are selectively killed by inhibitors of Notch (gamma-secretase inhibitors), showing that the proliferative advantage of these tumors is dependent upon Notch signaling. Our results show that the deregulation of the Notch pathway is a relatively frequent event in NSCLCs and suggest that it might represent a possible target for molecular therapies in these tumors.


Conflict of interest statement

The authors declare no conflict of interest.

Figures

Fig. 1.
Fig. 1.
Loss of NUMB expression in NSCLC. (A) NUMB expression in NSCLCs detected by IHC. Entire TMA cores, from representative samples, are shown on the left at an original magnification ×20; the boxed areas are magnified on the right (original magnification ×40) to show the typical cytosolic and plasma membrane localization of Numb. (B) (Left) NUMB mRNA levels measured by Q-PCR in primary NSCLC cultures expressed relative to the reference cell line BEAS-2B (= 1). Results represent the mean mRNA level detected in cultures from four patients for each NUMB-class shown. (Right) NUMB protein levels in primary NSCLC cultures. Blots are representative of three independent experiments.
Fig. 2.
Fig. 2.
NUMB expression and Notch signaling in NSCLCs. (A and B) Inverse correlation between NUMB and activated-NOTCH-1 status in NSCLCs. (A) Representative IHC in serial sections (original magnification ×40). (B) Quantitative assessment of activated-NOTCH-1 in NSCLC as a function of NUMB-class. (C) HES1 mRNA levels in NSCLCs displaying different levels of NUMB. Data were obtained by Q-PCR on frozen specimens of the cohort of 49 patients and are expressed relative to the reference cell line BEAS-2B (= 1). The six patients harboring mutations in the NOTCH-1 gene (see Figs. 3A and 5A) were excluded from the results reported in panels (B) and (C). (D) NUMB-class (measured by IHC) and HES1 levels, measured as in (C), in 10 primary cultures from NSCLC patients.
Fig. 3.
Fig. 3.
Mutations of the NOTCH-1 gene in NSCLCs. (A) Schematic representation of the NOTCH-1 protein with its domains: Ankyrin, ankyrin region; EC, extracellular; EGF-like, EGF-like repeats; HDC, heterodimerization domain C-terminal; HDN, heterodimerization domain N-terminal; LNR, Lin-12/Notch repeats; NICD, intracellular; N-N-TM, transmembrane; PEST, PEST region; RAM, RBP-J/Su(H)/CBF1-associated molecule; TAD, transactivation domain. Sequencing strategy indicating positions of the sequenced fragments (–7) is shown (top). Locations of the detected mutations, confirmed in two independent experiments, are indicated by red dots (bottom). Note that mutations did not show evident specificity for tumor histotype, as they were detected both in adenocarcinomas (three of 34 cases) and in squamous cell carcinomas (three of 15 cases). (B) An example of a somatic mutation (D1643H) in NOTCH-1, in patient 40: chromatograms of normal and tumor cDNAs are shown (arrowheads indicate the position of the G to C mutation). The complete dataset is in Fig. S2. Also note that, in three cases (cases 36, 40, and 44), the mutations allowed restriction polymorphism analysis that confirmed the presence of WT alleles in the normal tissues and the presence of heterozygous mutations in the tumor samples (Fig. S2). (C) HES1 mRNA levels in frozen normal (N) and tumor (T) lung tissue specimens from patients harboring mutations of the NOTCH-1 gene. Data are expressed relative to the reference cell line BEAS-2B (= 1). Asterisks indicate a P value <0.01 in tumor vs. normal.
Fig. 4.
Fig. 4.
NOTCH-1 mutations in NSCLCs are gain-of-function mutations. (A) Expression of flag-tagged NOTCH-1 constructs (shown on top) in HeLa cells. ΔTAD, inactive NOTCH-1 used as negative control. Note that the V2444fs mutant was expressed at very low levels and was detectable only in long exposures (asterisk). (B) Basal activity of NOTCH-1 mutants. HeLa cells were transfected with NOTCH-1 constructs (as indicated in (A) and a CBF1-Luc reporter. Luciferase activity was then determined in standard conditions (untreated) or after treatment with the GSIs, MRK-003 (1 μM) and DAPT (1 μM), and is reported as the fold increase vs. WT NOTCH-1, for each condition. In untreated cells, asterisks indicate a significant difference (P < 0.01) vs. WT control. In treated cells, red asterisks indicate a significant difference (P < 0.01) vs. the same transfectants in untreated conditions. (C) The effect of mutations on NOTCH-1 activation. HeLa transfectants were treated for 20 min with 5 mM EGTA or left untreated (NT). Cells were then washed to remove EGTA and returned to culture for an additional 0–3 h (EGTA release = 0, 1, 2 or 3 h). The levels of activated and total (FLAG) NOTCH-1 in total cell lysates were determined. A longer exposure of the blot for activated NOTCH-1 (long. exp.) is also shown to better visualize the kinetics of activated NOTCH-1 extinction in WT cells and V2444fs transfectants. (D) Densitometric analysis of the immunoblots shown in (C). (Top) amount of activated NOTCH-1 normalized to the NT sample in HeLa-WT NOTCH-1 cells (= 1). Data are expressed as arbitrary units (a.u.) relative to anti-FLAG signal. (Bottom) amount of activated NOTCH-1 expressed as a percentage of T 0 (= 100%) for each transfectant. (E) Subcellular localization of WT and S22275fs NOTCH-1. EGTA treatment and washout of HeLa cell transfectants was performed as in (C). The subcellular localization of NOTCH-1 was determined by immunofluorescence using an anti-FLAG antibody. Bar, 10 μM. Note how, in unstimulated cells, both WT and mutated NOTCH-1 displayed a predominantly extranuclear distribution. Upon EGTA treatment, a significant proportion of both WT and mutant NOTCH-1 translocated into the nucleus and was still visible in this location 1 h after washout. However, 3 h after washout, WT NOTCH-1 had completely disappeared from the nucleus, whereas persistent nuclear NOTCH-1 staining was detectable in S2275fs transfectants.
Fig. 5.
Fig. 5.
Impact of alterations of Notch signaling in NSCLC. (A) Summary of the alterations of the Notch signaling pathway in the cohort of 49 NSCLC patients. HES1 mRNA levels are reported vs. NUMB status (as described in Fig. 2C). The six patients harboring NOTCH-1 mutations are indicated by red dots. (B) HES1 mRNA levels (expressed relative to the reference cell line BEAS-2B = 1) in NSCLCs displaying different levels of activated NOTCH-1 by IHC. mRNA levels were measured by Q-PCR on frozen specimens of the cohort of 49 patients. (C) The activation status of NOTCH-1 was used to predict overall survival in the subgroup of p53-negative NSCLC patients (i.e., patients without TP53 mutations, n = 176, 48.9% of the entire NSCLC cohort). Data are shown as the probability of survival, in Kaplan–Meier plots, as a function of low (Low) or intermediate-to-high (Interm./High) activated-NOTCH-1 levels. (D) The activation status of NOTCH-1 (low vs. intermediate-to-high activated-NOTCH-1 levels) was tested for prediction of survival in the same cohort of patients as in (C), in a multivariate comparative analysis using the indicated biological and biochemical parameters. HR, hazard ratio. A value of P < 0.05 was considered statistically significant.
Fig. 6.
Fig. 6.
Inhibition of Notch signaling affects the growth potential of primary NSCLC cultures harboring alterations of the Notch pathway. A. Eight NSCLC primary cultures, representing 3 groups based on NOTCH-1/NUMB status, were tested for their sensitivity to the GSIs MRK-003 and DAPT. The characteristics of the primary cultures are summarized in the panel. (B and C) Survival of the primary NSCLC cultures, after treatment with MRK-003 (B) or DAPT (C) with respect to vehicle (DMSO). Results are expressed as the mean ± SEM of two independent experiments. (D) Summary of GSI experiments. Survival, with respect to vehicle-treated cells, is shown for the three types of NSCLC cultures described in (A): filled bars, “WT” cells (no alterations in the Notch pathway, see main text); empty bars, NUMB-negative cells; gray bars, NOTCH-1-mutated cells. Results for primary cultures belonging to the same group were combined and are expressed as the mean ± SEM of two independent experiments. Asterisks indicate a significant difference (P < 0.01) relative to vehicle-treated cells as well as to WT cells treated with MRK-003 (left) or DAPT (right).

Similar articles

Cited by

References

    1. Aster JC, Pear WS, Blacklow SC. Notch signaling in leukemia. Annu Rev Pathol. 2008;3:587–613. - PMC - PubMed
    1. Fiuza UM, Arias AM. Cell and molecular biology of Notch. J Endocrinol. 2007;194:459–474. - PubMed
    1. Gonczy P. Mechanisms of asymmetric cell division: Flies and worms pave the way. Nat Rev Mol Cell Biol. 2008;9:355–366. - PubMed
    1. Kageyama R, Ohtsuka T, Kobayashi T. The Hes gene family: Repressors and oscillators that orchestrate embryogenesis. Development. 2007;134:1243–1251. - PubMed
    1. Roegiers F, Jan YN. Asymmetric cell division. Curr Opin Cell Biol. 2004;16:195–205. - PubMed

Publication types

MeSH terms