. 2010 Feb 18;115(7):1425-32.
doi: 10.1182/blood-2009-09-242859. Epub 2009 Dec 10.

FLT3-mutant allelic burden and clinical status are predictive of response to FLT3 inhibitors in AML

Affiliations

FLT3-mutant allelic burden and clinical status are predictive of response to FLT3 inhibitors in AML

Keith W Pratz et al. Blood. .

Abstract

We examined 6 different FMS-like tyrosine kinase-3 (FLT3) inhibitors (lestaurtinib, midostaurin, AC220, KW-2449, sorafenib, and sunitinib) for potency against mutant and wild-type FLT3, as well as for cytotoxic effect against a series of primary blast samples obtained from patients with acute myeloid leukemia (AML) harboring internal tandem duplication (FLT3/ITD) mutations. We found that inhibition of FLT3 autophosphorylation in a FLT3/ITD specimen does not always induce cell death, suggesting that some FLT3/ITD AML may not be addicted to FLT3 signaling. Relapsed samples and samples with a high mutant allelic burden were more likely to be responsive to cytotoxicity from FLT3 inhibition compared with the samples obtained at diagnosis or those with a low mutant allelic burden. These FLT3 inhibitors varied to a considerable degree in their selectivity for FLT3, and this selectivity influenced the cytotoxic effect. These results have important implications for the potential therapeutic use of FLT3 inhibitors in that patients with newly diagnosed FLT3-mutant AML might be less likely to respond clinically to highly selective FLT3 inhibition.


Figures
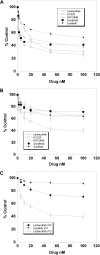
Figure 1
Figure 1
Cytotoxicity assays of FLT3/ITD primary AML samples. Peripheral blood blasts isolated from 13 patients with AML harboring FLT3/ITD mutations were incubated in increasing concentrations of each of the 5 FLT3 inhibitors indicated and analyzed using the MTT assay as described in “Cytotoxicity assays.” The experiment was repeated, and the data from both experiments was combined. (A) Dose-response curves for a single FLT3/ITD sample (No. 10 from Table 2) exposed to each of 5 FLT3 inhibitors. Error bars represent standard deviations. (B) Composite dose-response curves for all 5 inhibitors and all 13 FLT3/ITD samples. For each drug concentration, the percentage control for all 13 samples was expressed as a mean value, with error bars representing the SEMs. Each individual data point on these curves represents the mean of roughly 7 OD values for each of 13 different AML samples (ie, 7 × 13 = 91 OD values). (C) Composite dose-response curves for 14 wild-type FLT3 samples exposed to sunitinib (top curve) or lestaurtinib (middle curve).
Figure 2
Figure 2
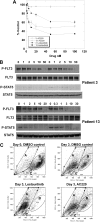
Cytotoxic effect is not exclusively dependent on inhibition of FLT3 autophosphorylation. (A) MTT assay dose-response curves for Sample 3 (circles) and Sample 13 (squares) incubated with AC220 (open symbols) and lestaurtinib (filled symbols). Error bars represent standard deviations. (B) Blasts from Sample 3 (top blots) and Sample 13 (bottom blots) were incubated for 1 hour in culture medium with the indicated concentrations of lestaurtinib (left) and AC220 (right). The blasts were then analyzed for phospho-FLT3 and phospho-STAT5 as described in “FLT3 phosphorylation.” (C) Blasts from Sample 3 were thawed and resuspended in culture medium. An aliquot was removed (Day 0), fixed, and stained with anti-CD33, anti-CD3, anti-CD19, and annexin V for flow cytometric analysis, and then the remaining blasts were divided into 3 cultures: DMSO control, lestaurtinib 50 nM, and AC220 50 nM. After 72 hours of culture, the blasts were fixed, stained, and analyzed for comparison with the day 0 blasts. Shown are the forward (x-axis) and side (y-axis) scatter plots. Gate A represents dead cells (annexin V+); gate B, viable blasts (annexin V, CD33+); gate C, lymphocytes (CD3+ or CD19+).
Figure 3
Figure 3
IL-3 rescue assay. BaF3/ITD cells were incubated in quadruplicate wells of a 96-well plate in culture medium with increasing concentrations of the inhibitors in the absence (left) or presence (right) of 1 ng/mL IL-3. After 48 hours, the MTT reagent was added and OD values were obtained. The dose-response curves were prepared as percentage control (DMSO only), and regression analysis was used to obtain IC50 values. The ratio of the IC50 in the presence of IL-3 divided by the IC50 in the absence of IL-3 is the IL-3 index, tabulated below the graphs.
Figure 4
Figure 4
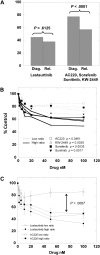
Cytotoxic response according to clinical status. (A) The results of the MTT assay for the 8 diagnostic samples versus the 5 relapsed samples exposed to 50 nM of either lestaurtinib (left) or 50 nM of the other 4 inhibitors averaged (right). Comparison was made using the Student 2-tailed t test. (B) Composite dose-response curves for 4 inhibitors (AC220, KW-2449, sorafenib, sunitinib) against low mutant ratio (Table 1; Samples 1-6, 8; thin dashed lines) and high mutant ratio (Table 1; Samples 7, 9-13; solid lines) FLT3/ITD samples. For each drug concentration, the percentage control for all samples was expressed as a mean value. Error bars, representing the SEMs, were all less than 3%, and were omitted for graph clarity. Comparison was made using the Student 2-tailed t test. (C) Composite dose-response curves for AC220 and lestaurtinib against low and high mutant ratio samples (as in panel B). For each drug concentration, the percentage control for all samples tested was expressed as a mean value, with error bars representing the SEMs. Comparison was made using the Student 2-tailed t test, with the arrow denoting a P value for AC220 low versus high allelic ratio samples.

Similar articles

Cited by

References

    1. Levis M, Small D. FLT3: ITDoes matter in leukemia. Leukemia. 2003;17(9):1738–1752. - PubMed
    1. Levis M, Small D. FLT3 tyrosine kinase inhibitors. Int J Hematol. 2005;82(2):100–107. - PubMed
    1. Knapper S. FLT3 inhibition in acute myeloid leukaemia. Br J Haematol. 2007;138(6):687–699. - PubMed
    1. Levis M, Smith BD, Beran M, et al. A randomized, open-label study of lestaurtinib (CEP-701), an oral FLT3 inhibitor, administered in sequence with chemotherapy in patients with relapsed AML harboring FLT3 activating mutations: clinical response correlates with successful FLT3 inhibition [abstract]. Blood. 2005;106:121a. Abstract 403.
    1. Cortes J, Foran J, Devetten M, et al. Human pharmacokinetics of AC220, a potent and selective Class III receptor tyrosine kinase inhibitor [abstract]. Blood. 2007;110(11):477a. Abstract 1597.

Publication types

MeSH terms