Review
. 2009 Dec;15(6):651-68.
doi: 10.1177/1073858409341973.

Electrogenic tuning of the axon initial segment

Affiliations
Review

Electrogenic tuning of the axon initial segment

Brian D Clark et al. Neuroscientist. 2009 Dec.

Abstract

Action potentials (APs) provide the primary means of rapid information transfer in the nervous system. Where exactly these signals are initiated in neurons has been a basic question in neurobiology and the subject of extensive study. Converging lines of evidence indicate that APs are initiated in a discrete and highly specialized portion of the axon-the axon initial segment (AIS). The authors review key aspects of the organization and function of the AIS and focus on recent work that has provided important insights into its electrical signaling properties. In addition to its main role in AP initiation, the new findings suggest that the AIS is also a site of complex AP modulation by specific types of ion channels localized to this axonal domain.


Figures

Figure 1
Figure 1
Early studies of the axon. A, Deiters’ illustration of isolated motor neurons from the anterior horn of the spinal cord. In the large cell at the left, he differentiates (a) the single “main axis cylinder extension” from the (b) multiple “fine axis cylinder extensions coming from the protoplasmic extensions…” (Deiters 1865; reproduced by permission of Oxford University Press, Inc, from Shepherd 1991). Based on these descriptions, Deiters is often credited with first distinguishing the axon from dendrites. B, Edwards and Ottoson’s demonstration of axonal initiation of orthodromic impulses in the giant lobster stretch receptor. Using a preparation in which simultaneous extracellular electrodes could be visually positioned at the soma (E) and at varying distances along the axon (A–D), Edwards and Ottoson showed that in response to activation by stretch, the spike is first recorded at site B, about 500 μm from the cell body (negativity is upward in these extracellular tracings; from Edwards and Ottoson 1958). C, Electron micrograph of a pyramidal cell axon initial segment from rat cerebral cortex. The axon hillock is at the top of the image. Arrows indicate the beginning of the characteristic undercoating and the beginning of the axon initial segment (from Palay and others, copyright 1968. Originally published in The Journal of Cell Biology, 38:193–201).
Figure 2
Figure 2
Electrical and optical recording of spike initiation and Na+ concentration at the axon initial segment (AIS) of cortical layer 5 pyramidal cells. A, top, Infrared-differential interference contrast (IR-DIC) image of simultaneous somatic and axonal whole-cell recording from a layer 5 pyramidal neuron in an acute brain slice. Bottom, Superimposed traces of simultaneous somatic and axonal (thicker trace) recordings in response to extracellular stimulation. The spike recorded at the AIS precedes the spike recorded in the soma (from Stuart and others 1997a). B, Simultaneous imaging of the membrane potential in the soma and proximal axon with voltage-sensitive dye JPW1114. Action potential initiation occurred within the AIS approximately 35 μm from the axon hillock (from Palmer and Stuart 2006). C, Kole and others used the sodium-sensitive dye SBFI to monitor sodium concentration in the axon during a train of action potentials. Consistent with a high local density of sodium channels at the AIS, they found sodium transients were greatest approximately 25 μm from the axon hillock. Adapted by permission from Macmillan Publishers Ltd: Nature Neuroscience (Kole and others, copyright 2008).
Figure 3
Figure 3
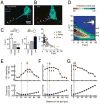
Precise sodium channel distribution within the axon initial segment (AIS) fine-tunes neuronal responsiveness in the chick nucleus laminaris. The Na+ channel “hot spot” is arranged at greater distances from the cell body as the characteristic frequency (CF) of the neuron increases. A, B, Examples of Na+ channel hot spot localization in high-middle CF neurons (A) and low CF neurons (B). Nav channels = red; retrogradely labeled nucleus laminaris neurons = green. C, Relationship between geometry of axonal Na+ hot spot (Nav immunoreactivity) and CF found in nucleus laminaris (NL) neurons. High CF neurons had shorter hot spots (L) located at greater distance from the cell body (D), whereas low CF neurons hot spots were longer and closer to the cell body (yellow symbols are averages). D, Varying the geometry of the hot spot in multicompartment model simulations of NL neurons showed that the geometry producing the lowest threshold current (color coded; red corresponds to lowest threshold current) resembled the observed distribution of Na+ channels in NL neurons (shown in C). E–G, Dependence of interaural timing difference (ITD) sensitivity and threshold current on distance of Na+ hot spot from soma in model simulations of NL neurons. E, High CF (L = 10 μm). F, Middle CF (L = 15 μm). G, Low CF (L = 25 μm). Asterisks denote minimum threshold from data in panel D. Yellow symbols and red dotted lines indicate the actual observed average distances from data in panel C. Arrowheads show the maximum ITD sensitivity. Adapted by permission from Macmillan Publishers Ltd: Nature Kuba and others, copyright 2006.
Figure 4
Figure 4
Kv1-mediated currents at the axon initial segment (AIS) regulate neocortical fast-spiking (FS) interneuron near-threshold excitability. FS cells in superficial layers of somatosensory cortex respond to near-threshold depolarizing current steps with delayed firing. A, Increasing amounts of depolarizing current injection first produces slow depolarization (bottom Vm trace; expanded in C) followed by delayed firing, and with sufficient current, continuous firing. B, Delayed firing is associated with a positive shift in voltage threshold. Shown are the action potentials (APs) indicated in A; first AP during delayed firing (red trace) and time-matched AP during continuous firing (blue trace). C, Just subthreshold depolarizations produce a slow ramp depolarization in layer 2/3 FS cells (red; single exponential fit, t = 118 ms; arrow, amplitude 4.9 mV). D, Local application of DTX-K at the FS cell AIS abolishes the near-threshold slow ramp depolarization and delayed firing. Modified from Goldberg and others (2008) with permission from Elsevier.
Figure 5
Figure 5
Kv1.1 subunits are enriched at the axon initial segment (AIS) of neocortical fast-spiking (FS) interneurons. Left panels, A–C, Immunolocalization of Kv1.1 protein in mouse somatosensory cortex. A, Confocal image of double immunolabeling for Kv1.1 and the AIS marker, Ankyrin G (AnkG), in cortex of a transgenic mouse expressing EGFP in FS cells. Left panel, Superimposed EGFP (green) and AnkG (light blue) labeling. Middle panel, Kv1.1 staining (red). Right panel, Merged image showing all three signals. Note the enriched Kv1.1 staining in EGFP-labeled FS cells. Boxed region is magnified in B. B, Higher magnification of FS cells in boxed region in A. Kv1.1 protein colocalizes with AnkG at the AIS of FS cells (arrowheads). Somatic Kv1.1 staining in FS cells surrounded the nucleus, consistent with intracellular protein localization in the soma (insets). C, Additional example of Kv1.1 enrichment at the AIS of EGFP-positive FS cell. Right panels (a–e), Kv1.1 protein is enriched at axonal but not somatic membrane. a, Montage image of successive electron micrographs of Kv1.1-immunopositive nonpyramidal cell. Boxed regions are shown in b to e. Note intracellular Kv1.1 labeling in b and c, the lack of Kv1.1 labeling at the plasma membrane of the soma (c) and the axon hillock (d), and the concentration of Kv1.1 labeling at the membrane of the AIS in e. Red arrowheads outline the somatic plasma membrane in c, and the axonal plasma membrane in d and e. Modified from Goldberg and others (2008) with permission from Elsevier.
Figure 6
Figure 6
Axonal Kv1 channels selectively control axonal action potential (AP) waveform in neocortical pyramidal cells. A, Image of layer 5 pyramidal cell indicating the AIS and cut axonal bleb. B, Simultaneous whole-cell recordings from the soma (black traces) and the axon initial segment (AIS) or axon bleb (red traces). Dotted line (t = 0) indicates the onset of the somatically recorded AP. Note the AP recorded at the AIS precedes the somatic AP; also note the differences in AP duration between the soma and axonal recordings. C, AP waveform narrows in the axon. Shown are example APs recorded at the soma (black) and at increasing distances along the axon (red traces). D, Plot of axonal AP duration (AP width at half-amplitude: half-width, μs) as a function of recording distance from the axon hillock (μm). E, Local application of Kv1 channel blocker, dendrotoxin-I (DTX-I) at the AIS selectively increases axonal but not somatic AP duration. Shown are the axonal AP before (black) and after (red) DTX-I at the AIS. Modified from (Kole and others 2007) with permission from Elsevier.
Figure 7
Figure 7
Presynaptic somatic membrane potential modulates synaptic transmission via the slow inactivation of axonal Kv1 channels in neocortical pyramidal cells. A, Recording protocol from Shu and others (2006) in which the presynaptic layer 5 pyramidal cell membrane potential is alternatively held near rest (−62 mV in this example) or near firing threshold (−48 mV), and brief stimuli produce action potentials (APs; at 0.8 Hz) from each membrane potential. The resulting excitatory post-synaptic potential (EPSPs) in the postsynaptic pyramidal cell are shown in B. B, APs produce facilitated postsynaptic responses when the presynaptic membrane is depolarized (−48 mV; red trace). C, Average time course of facilitation and disfacilitation of EPSPs. Adapted by permission from Macmillan Publishers Ltd: Nature (Shu and others 2006), © 2006. D, Depolarized presynaptic membrane potential-induced facilitation of EPSPs is abolished by Kv1 channel blocker dendrotoxin-I (DTX-I). Plot illustrates the facilitation of EPSPs by increasing durations (Δt) of presynaptic depolarization (solid circles) and block by DTX-I (open circles). Modified from Kole and others (2007) with permission from Elsevier. E, F, Somatic depolarization and DTX-I do not increase unitary AP-evoked GABA postsynaptic potentials (uGPSP) in fast-spiking (FS) interneuron → pyramidal cell (PC) pairs. E, APs evoked from depolarized presynaptic potentials (green traces; −50 mV; sufficient to produce Kv1 channel inactivation based on lack of delayed firing in presynaptic FS cell, E1) or hyperpolarized (~−70 mV) potentials (black traces) produce no change in uGPSP amplitude. However, application of 1 mM TEA, which blocks Kv3 channels, produces an approximately twofold increase in uGPSP amplitude, consistent with previous results (Goldberg and others 2005). F, Bath application of DTX-I has no effect on uGPSP amplitude in FS → PC pairs. F1, Summary data (n = 3). Modified from Goldberg and others (2008) with permission from Elsevier.

Similar articles

Cited by

References

    1. Alle H, Geiger JR. Analog signalling in mammalian cortical axons. Curr Opin Neurobiol. 2008;18:314–20. - PubMed
    1. Araki T, Otani T. Response of single motoneurons to direct stimulation in toad’s spinal cord. J Neurophysiol. 1955;18:472–85. - PubMed
    1. Bekkers JM, Delaney AJ. Modulation of excitability by alpha-dendrotoxin-sensitive potassium channels in neocortical pyramidal neurons. J Neurosci. 2001;21:6553–60. - PMC - PubMed
    1. Bender KJ, Trussell LO. Axon initial segment Ca2+ channels influence action potential generation and timing. Neuron. 2009;61:259–71. - PMC - PubMed
    1. Bishop PO. Synaptic transmission; an analysis of the electrical activity of the lateral geniculate nucleus in the cat after optic nerve stimulation. Proc R Soc Lond B Biol Sci. 1953;141:362–92. - PubMed

LinkOut - more resources