

The role of CD4+CD25+ regulatory T cells in macrophage-derived foam-cell formation
- PMID: 20007839
- PMCID: PMC2853448
- DOI: 10.1194/jlr.D000497
The role of CD4+CD25+ regulatory T cells in macrophage-derived foam-cell formation
Abstract
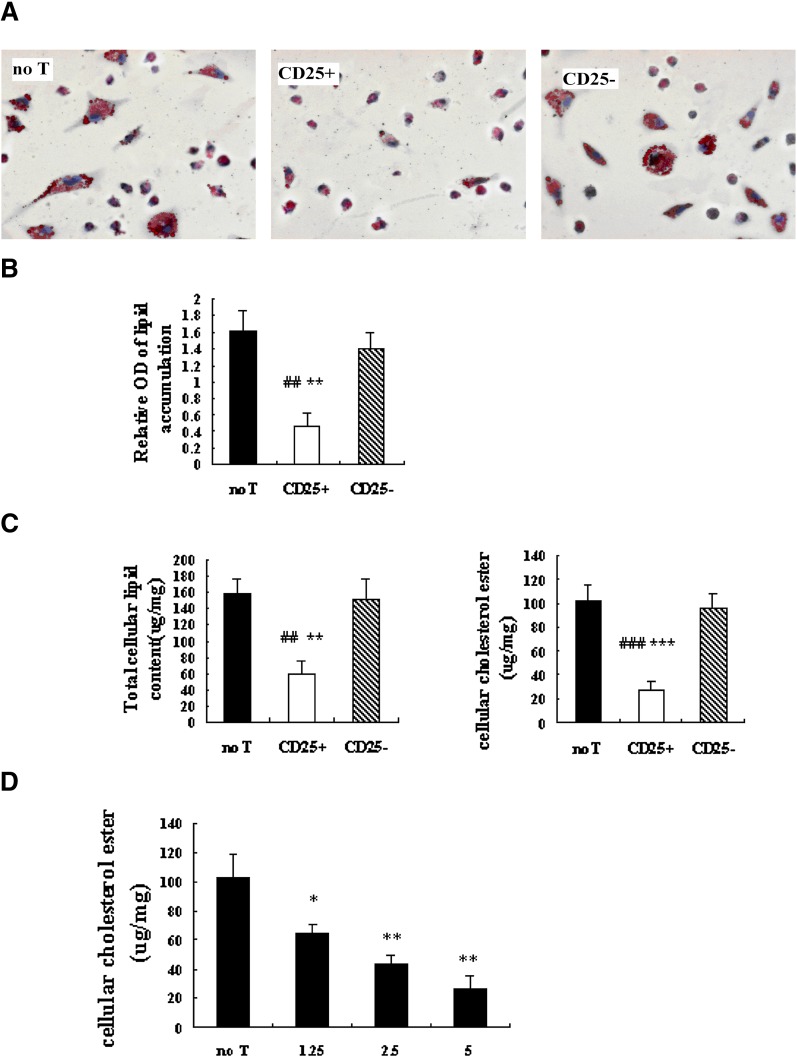
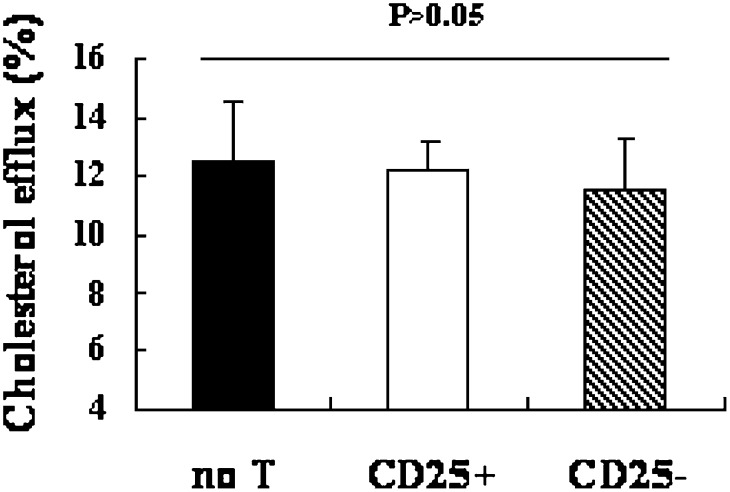
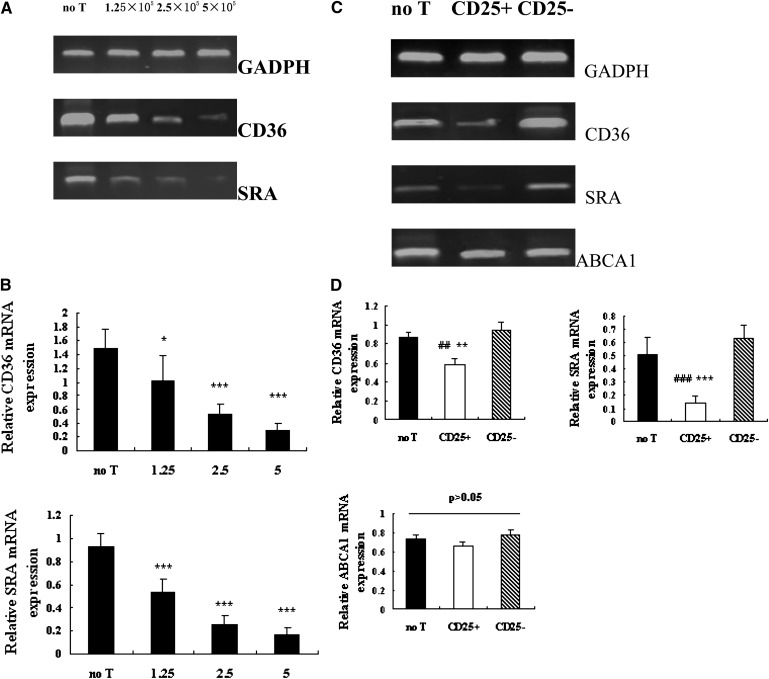
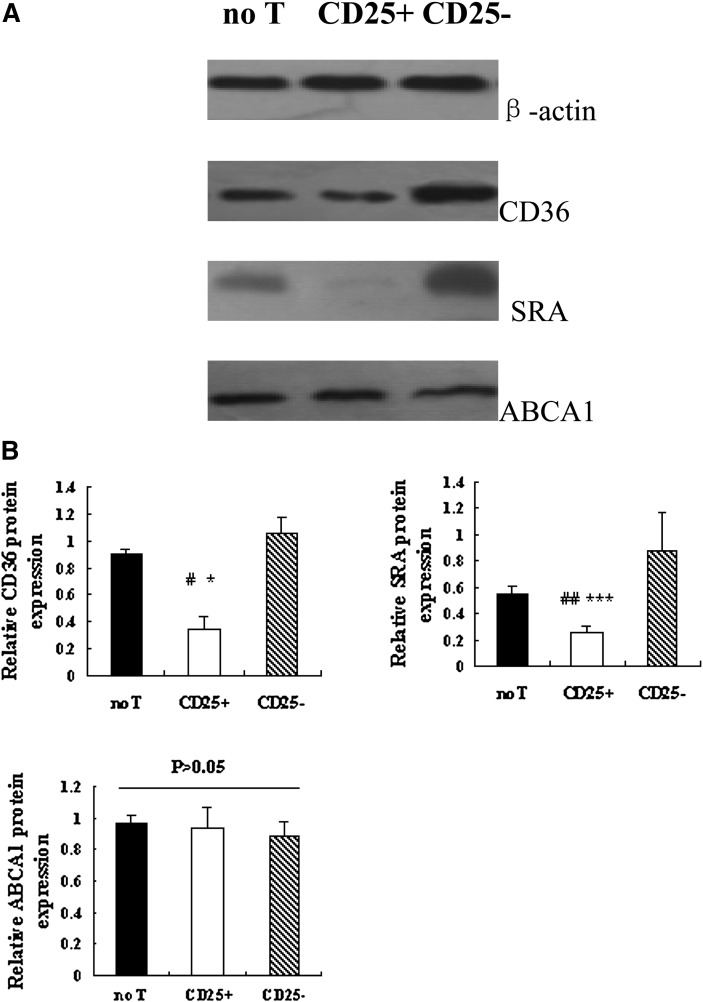
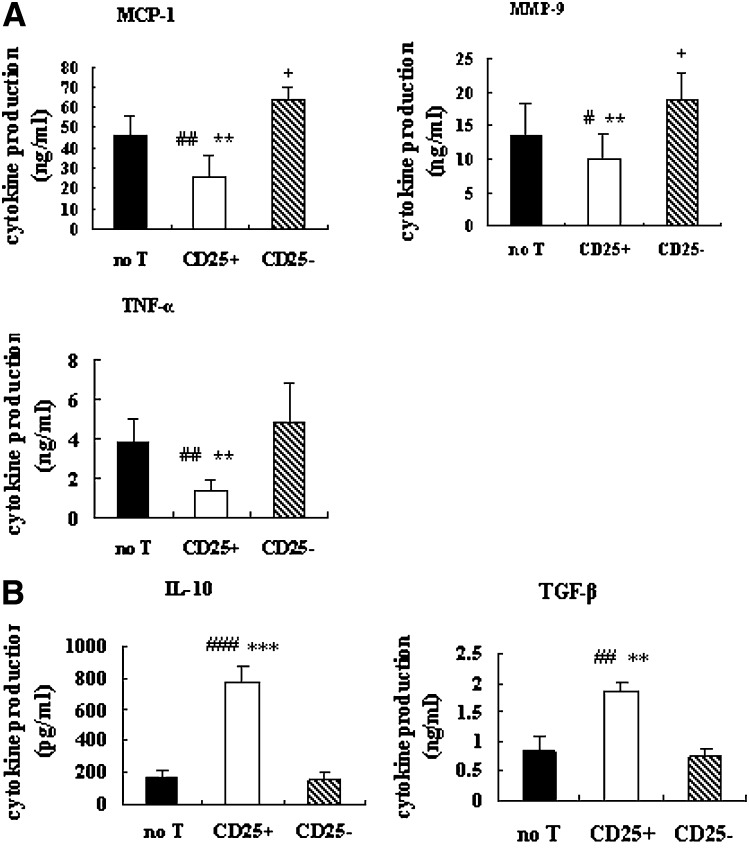
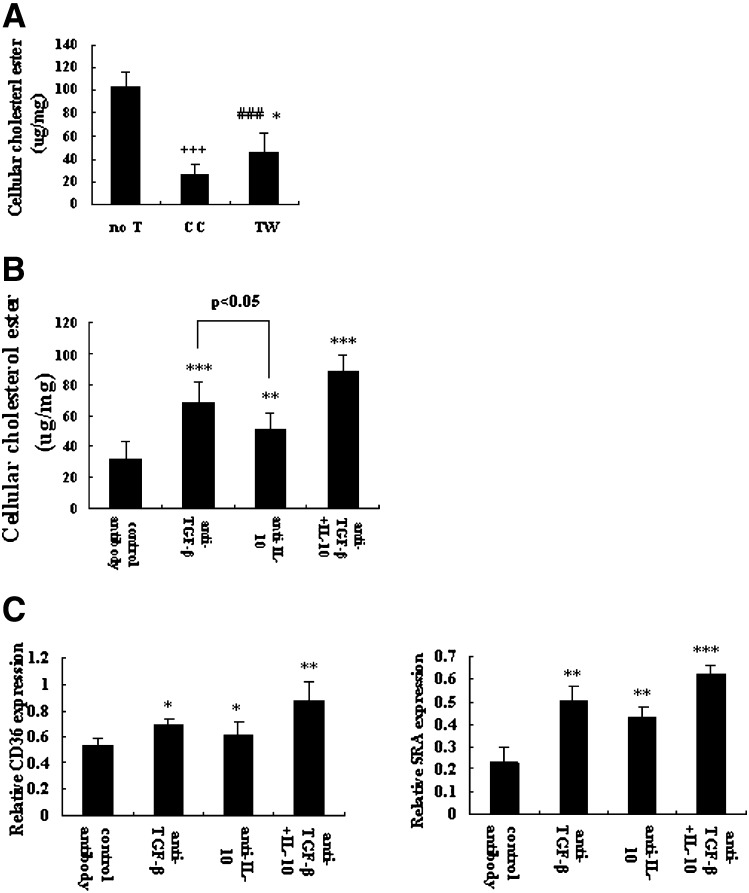
Cluster of differentiation (CD)4+CD25+ regulatory T cells (Tregs) exert a suppressive activity on atherosclerosis, but the underlying mechanism remains unclear. Here, we investigated whether and how Tregs affect macrophages foam-cell formation. Tregs were isolated by magnetic cell sorting-column and analyzed by flow cytometry. Macrophages were cultured with or without Tregs in the presence of oxidized LDL (oxLDL) for 48 h to transform foam cells. After co-culture with Tregs, macrophages showed a decrease in lipid accumulation, which was accompanied by a significantly downregulated expression of CD36 and SRA but no obvious difference in ABCA1 expression. Tregs can inhibit the proinflammatory properties of macrophages and steer macrophage differentiation toward an anti-inflammatory cytokine producing phenotype. Mechanistic studies reveal that both cell-to-cell contact and soluble factors are required for Treg-mediated suppression on macrophage foam-cell formation. Cytokines, interleukin-10 (IL-10), and transforming growth factor-beta (TGF-beta) are the key factors for these suppressive functions.
Figures
Similar articles
-
Oxidized low-density lipoprotein-induced proinflammatory cytokine response in macrophages are suppressed by CD4CD25(+)Foxp3(+) regulatory T cells through downregulating toll like receptor 2-mediated activation of NF-kappaB.Cell Physiol Biochem. 2010;25(6):649-56. doi: 10.1159/000315084. Epub 2010 May 18. Cell Physiol Biochem. 2010. PMID: 20511710
-
CD4+CD25+Foxp3+ regulatory T cells protect the proinflammatory activation of human umbilical vein endothelial cells.Arterioscler Thromb Vasc Biol. 2010 Dec;30(12):2621-30. doi: 10.1161/ATVBAHA.110.210492. Epub 2010 Oct 7. Arterioscler Thromb Vasc Biol. 2010. PMID: 20930173
-
Toll-like receptor 4 mediates oxidized LDL-induced macrophage differentiation to foam cells.J Surg Res. 2011 Nov;171(1):e27-31. doi: 10.1016/j.jss.2011.06.033. Epub 2011 Jul 19. J Surg Res. 2011. PMID: 21920554
-
Mesenchymal stem cells alleviate atherosclerosis by elevating number and function of CD4(+)CD25 (+)FOXP3 (+) regulatory T-cells and inhibiting macrophage foam cell formation.Mol Cell Biochem. 2015 Feb;400(1-2):163-72. doi: 10.1007/s11010-014-2272-3. Epub 2014 Nov 12. Mol Cell Biochem. 2015. PMID: 25389006
-
The role of lipid metabolism in shaping the expansion and the function of regulatory T cells.Clin Exp Immunol. 2022 Jun 11;208(2):181-192. doi: 10.1093/cei/uxab033. Clin Exp Immunol. 2022. PMID: 35020862 Free PMC article. Review.
Cited by
-
Research Progress on the Role of Regulatory T Cell in Tumor Microenvironment in the Treatment of Breast Cancer.Front Oncol. 2021 Nov 15;11:766248. doi: 10.3389/fonc.2021.766248. eCollection 2021. Front Oncol. 2021. PMID: 34868991 Free PMC article. Review.
-
Recombinant Klotho protein enhances cholesterol efflux of THP-1 macrophage-derived foam cells via suppressing Wnt/β-catenin signaling pathway.BMC Cardiovasc Disord. 2020 Mar 5;20(1):120. doi: 10.1186/s12872-020-01400-9. BMC Cardiovasc Disord. 2020. PMID: 32138681 Free PMC article.
-
Association between Immune Checkpoint Inhibitors and Atherosclerotic Cardiovascular Disease Risk: Another Brick in the Wall.Int J Mol Sci. 2024 Feb 21;25(5):2502. doi: 10.3390/ijms25052502. Int J Mol Sci. 2024. PMID: 38473748 Free PMC article. Review.
-
Regulatory T Cells in Atherosclerosis: Is Adoptive Cell Therapy Possible?Life (Basel). 2023 Sep 18;13(9):1931. doi: 10.3390/life13091931. Life (Basel). 2023. PMID: 37763334 Free PMC article. Review.
-
T cells in atherosclerosis.Int Immunol. 2013 Nov;25(11):615-22. doi: 10.1093/intimm/dxt043. Int Immunol. 2013. PMID: 24154816 Free PMC article. Review.
References
-
- Hansson G. K. 2005. Inflammation, atherosclerosis, and coronary artery disease. N. Engl. J. Med. 352: 1685–1695. - PubMed
-
- Libby P. 2002. Inflammation in atherosclerosis. Nature. 420: 868–874. - PubMed
-
- Binder C. J., Chang M. K., Shaw P. X., Miller Y. I., Hartvigsen K., Dewan A., Witztum J. L. 2002. Innate and acquired immunity in atherogenesis. Nat. Med. 8: 1218–1226. - PubMed
-
- Sakaguchi S. 2005. Naturally arising Foxp3-expressing CD25+CD4+ regulatory T cells in immunological tolerance to self and non-self. Nat. Immunol. 6: 345–352. - PubMed
-
- Lindley S., Davan C. S., Bishop A., Roep B. O., Peakman M., Tree T. I. 2005. Defective suppressor function in CD4+CD25+ T-cells from patients with type 1 diabetes. Diabetes. 54: 92–99. - PubMed
Publication types
MeSH terms
Substances
LinkOut - more resources
Full Text Sources
Research Materials
