. 2010 Jan;12(1):91-101.
doi: 10.2353/jmoldx.2010.090085. Epub 2009 Dec 10.

High-throughput identification and quantification of Candida species using high resolution derivative melt analysis of panfungal amplicons

Affiliations

High-throughput identification and quantification of Candida species using high resolution derivative melt analysis of panfungal amplicons

Tasneem Mandviwala et al. J Mol Diagn. 2010 Jan.

Abstract

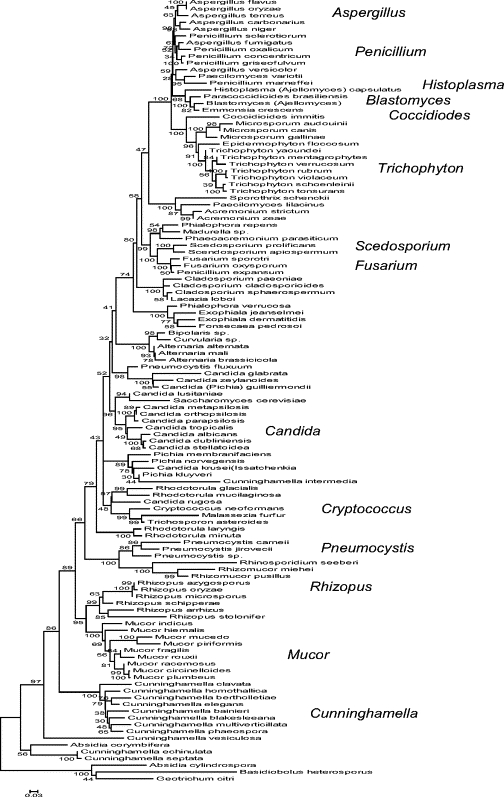
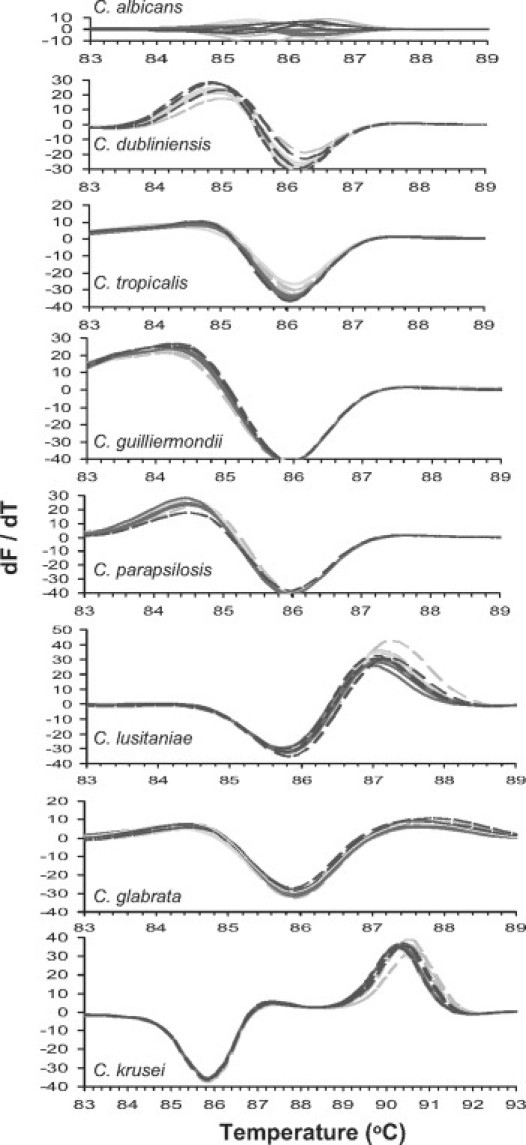
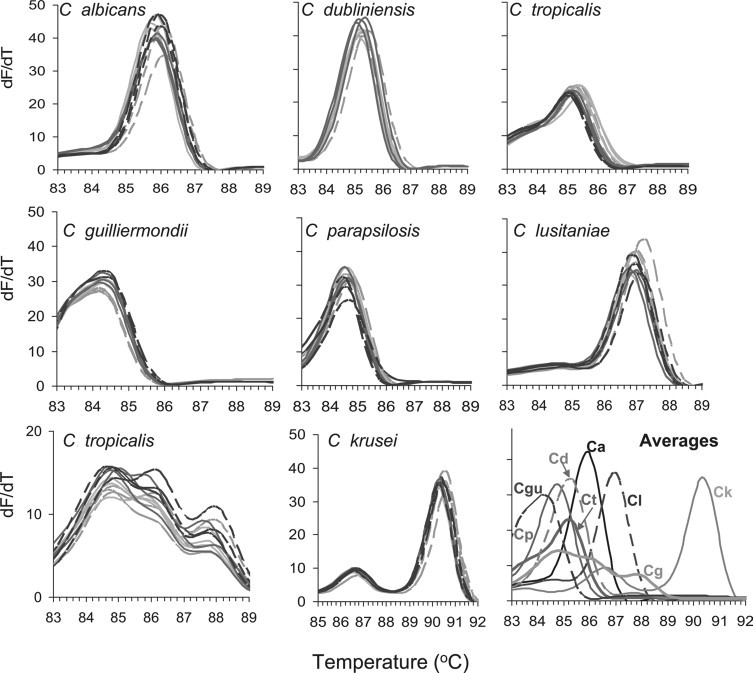
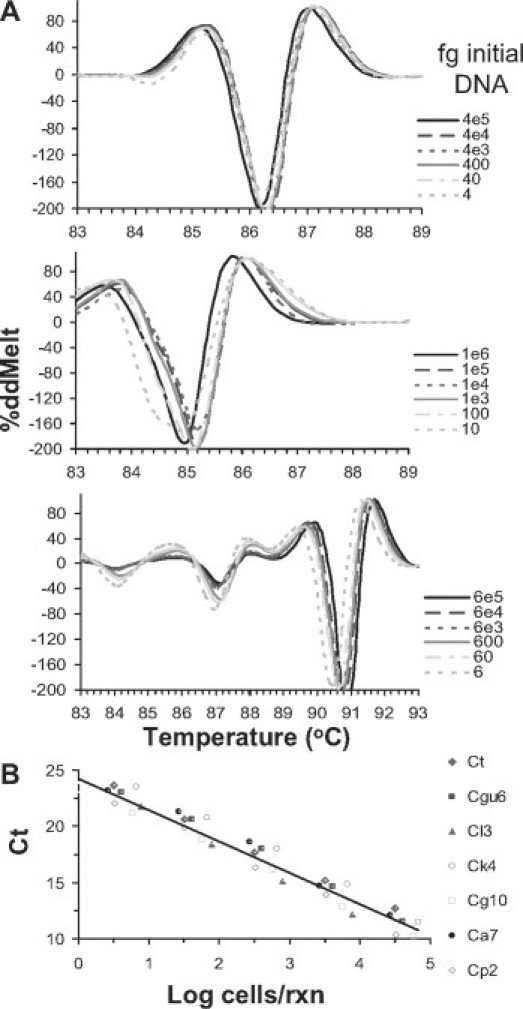
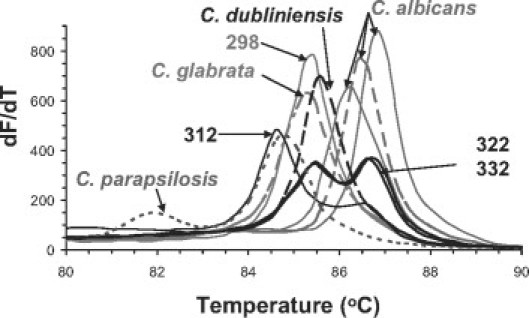
Fungal infections pose unique challenges to molecular diagnostics; fungal molecular diagnostics consequently lags behind bacterial and viral counterparts. Nevertheless, fungal infections are often life-threatening, and early detection and identification of species is crucial to successful intervention. A high throughput PCR-based method is needed that is independent of culture, is sensitive to the level of one fungal cell per milliliter of blood or other tissue types, and is capable of detecting species and resistance mutations. We introduce the use of high resolution melt analysis, in combination with more sensitive, inclusive, and appropriately positioned panfungal primers, to address these needs. PCR-based amplification of the variable internal transcribed regions of the rDNA genes generates an amplicon whose sequence melts with a shape that is characteristic and therefore diagnostic of the species. Simple analysis of the differences between test and reference melt curves generates a single number that calls the species. Early indications suggest that high resolution melt analysis can distinguish all eight major species of Candida of clinical significance without interference from excess human DNA. Candida species, including mixed and novel species, can be identified directly in vaginal samples. This tool can potentially detect, count, and identify fungi in hundreds of samples per day without further manipulation, costs, or delays, offering a major step forward in fungal molecular diagnostics.


Figures

Figure 1
Figure 1
Evolutionary relationships of rDNA ITS1-ITS2 sequences of fungal pathogenic species. Representative sequences for each species were taken from the NCBI database or derived from isolates in this study. Sequences were aligned and trimmed to common ends defined by the panfungal primer binding sites, using MEGA4. Their evolutionary history was inferred using the Neighbor-Joining method; largely similar trees were derived using other available phylogenetic tools. The bootstrap consensus tree inferred from 500 replicates is taken to represent the evolutionary history of the taxa analyzed. The percentage of replicate trees in which the associated taxa clustered together in the bootstrap test (500 replicates) are shown next to the branches. The tree is drawn to scale, with branch lengths in the same units as those of the evolutionary distances used to infer the phylogenetic tree. The evolutionary distances were computed using the Maximum Composite Likelihood method and are in the units of the number of base substitutions per site. All positions containing alignment gaps and missing data were eliminated only in pairwise sequence comparisons (Pairwise deletion option). There were a total of 1359 positions in the final dataset. Phylogenetic analyses were conducted in MEGA4. Human and a few fungal plant pathogens are included. Note that some species are outliers relative to the position they should hold in the tree (eg, Penicillium expansum); these may reflect misidentifications or errors in sequencing and indicate that multiple independent reads per species should be used.
Figure 2
Figure 2
First derivative ITS1-2 melt curves (dMelt) of Candida species. Genomic DNA (∼1 ng) of four independent isolates of each species was amplified in triplicate, and analyzed using the melting temperature calling algorithm of the Lightcycler 480. First derivative curves were derived from non-normalized melt curves. Each of the triplicate curves is shown individually to convey their reproducibility. An average normalized melt curve was calculated from up to 10 independent isolates of each species.
Figure 3
Figure 3
ΔdMelt analysis of ITS1-2 domains of Candida species. Average dMelt curves for C. albicans were determined by averaging dMelt curves of triplicate reactions of 10 independent isolates. These reference curves were subtracted from dMelt curves of four test isolates of each Candida species, performed in triplicate to generate the two sets of difference curves.
Figure 4
Figure 4
%ddMelt analysis and quantification of serially diluted Candida genomic DNA (gDNA). Genomic DNA of each species C. albicans (top), C. parapsilosis (middle), C. krusei (bottom) was serially diluted and amplified to obtain ITS1-2 amplicons, in the presence of an excess (10 ng) human DNA. A: Second derivatives of each melt curve were determined, and set on a percentage scale, setting the maximum positive value at 100%. B: Quantification of Candida species. Ct values are proportional to initial template concentrations over five orders of magnitude, and report an amplification efficiency of ∼2.1, slightly higher than 2, due to progressively increasing but small contribution of non-templated product as initial template concentration decreases. The linear regression plot includes data from seven species with a correlation coefficient of −0.95. Data are reported as cell equivalents per reaction, assuming the diploid C. albicans genome is ∼30 Mb, which ≅ 40 fg and has 110 copies of the rDNA genes, template concentration was determined with the fluorescence Quant-it assay.
Figure 5
Figure 5
Identification of Candida species in vaginal samples of VVC patients. Twenty-two samples from culture-positive, symptomatic VVC patients were amplified with ITS2 primers. dMelt curves were averaged from duplicate or triplicate assays and plotted (solid lines) next to curves derived from select reference species (dashed lines). Atypical profiles are labeled with their 3-digit codes. The 18 samples with C. albicans profiles were summarized by showing the two most extreme variants (solid lines) and the averaged curve (dashed line) for the group.

Similar articles

Cited by

References

    1. White PL, Barton R, Guiver M, Linton CJ, Wilson S, Smith M, Gomez BL, Carr MJ, Kimmitt PT, Seaton S, Rajakumar K, Holyoake T, Kibbler CC, Johnson E, Hobson RP, Jones B, Barnes RA. A consensus on fungal polymerase chain reaction diagnosis? a United Kingdom-Ireland evaluation of polymerase chain reaction methods for detection of systemic fungal infections. J Mol Diagn. 2006;8:376–384. - PMC - PubMed
    1. Baskova L, Landlinger C, Preuner S, Lion T. The Pan-AC assay: a single-reaction real-time PCR test for quantitative detection of a broad range of Aspergillus and Candida species. J Med Microbiol. 2007;56:1167–1173. - PubMed
    1. De Marco D, Perotti M, Ossi CM, Burioni R, Clementi M, Mancini N. Development and validation of a molecular method for the diagnosis of medically important fungal infections. New Microbiol. 2007;30:308–312. - PubMed
    1. Dial SM. Fungal diagnostics: current techniques and future trends. Vet Clinics N Am. 2007;37:373–392. - PubMed
    1. Lau A, Chen S, Sorrell T, Carter D, Malik R, Martin P, Halliday C. Development and clinical application of a panfungal PCR assay to detect and identify fungal DNA in tissue specimens. J Clin Microbiol. 2007;45:380–385. - PMC - PubMed

Publication types