. 2010 Mar;59(3):714-25.
doi: 10.2337/db09-0911. Epub 2009 Dec 10.

A central role of RLIP76 in regulation of glycemic control

Affiliations

A central role of RLIP76 in regulation of glycemic control

Sanjay Awasthi et al. Diabetes. 2010 Mar.

Abstract

Objective: Pathology associated with oxidative stress frequently results in insulin resistance. Glutathione (GSH) and GSH-linked metabolism is a primary defense against oxidative stress. Electrophilic lipid alkenals, such as 4-hydroxy-t-2-nonenal (4HNE), generated during oxidative stress are metabolized primarily to glutathione electrophile (GS-E) conjugates. Recent studies show that RLIP76 is the primary GS-E conjugate transporter in cells, and a regulator of oxidative-stress response. Because RLIP76(-/-) mice are hypoglycemic, we studied the role of RLIP76 in insulin resistance.

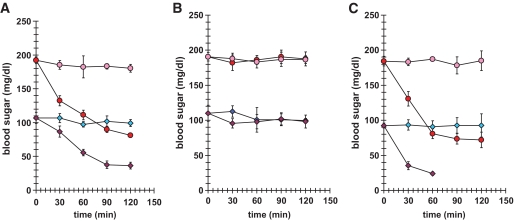
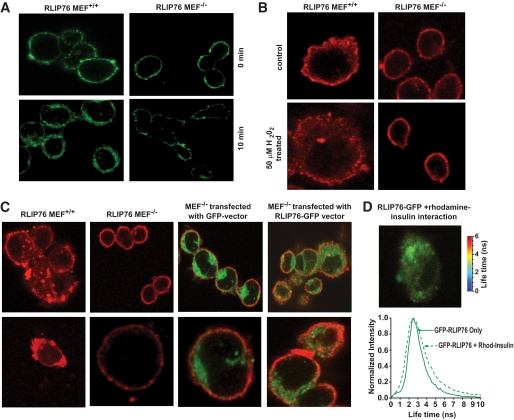
Research design and methods: Blood glucose, insulin, lipid measurements, and hyperinsulinemic-euglycemic and hyperglycemic clamp experiments were performed in RLIP76(+/+) and RLIP76(-/-) C57B mice, using Institutional Animal Care and Use Committee-approved protocols. Time-resolved three-dimensional confocal fluorescence microscopy was used to study insulin endocytosis.

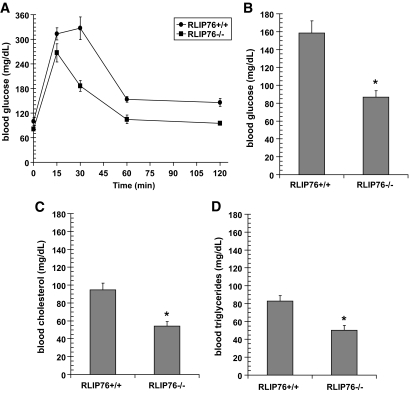
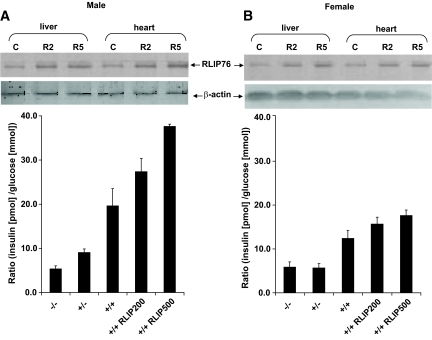
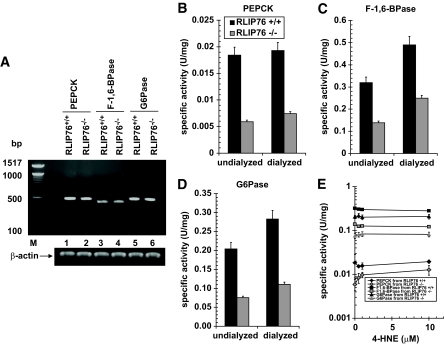
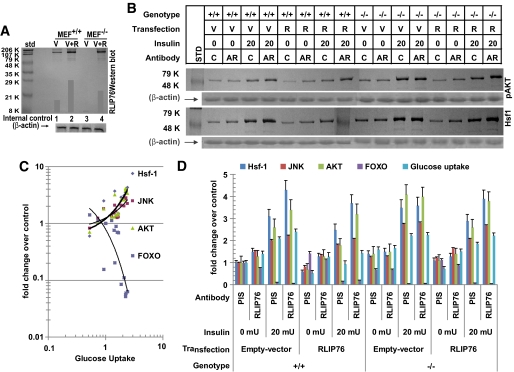
Results: The plasma insulin/glucose ratio was ordered RLIP76(-/-) < RLIP76(+/-) < RLIP76(+/+); administration of purified RLIP76 in proteoliposomes to RLIP76(+/+) animals further increased this ratio. RLIP76 was induced by oxidative or hyperglycemic stress; the concomitant increase in insulin endocytosis was completely abrogated by inhibiting the transport activity of RLIP76. Hydrocortisone could transiently correct hypoglycemia in RLIP76(-/-) animals, despite inhibited activity of key glucocorticoid-regulated hepatic gluconeogenic enzymes, phosphoenolpyruvate carboxykinase, glucose-6-phosphatase, and fructose 1,6-bisphosphatase, in RLIP76(-/-).

Conclusions: The GS-E conjugate transport activity of RLIP76 mediates insulin resistance by enhancing the rate of clathrin-dependent endocytosis of insulin. Because RLIP76 is induced by oxidative stress, it could play a role in insulin resistance seen in pathological conditions characterized by increased oxidative stress.


Figures

FIG. 1.
FIG. 1.
Effect of intraperitoneal administration of insulin on blood glucose in RLIP76+/+ vs. RLIP76−/− animals. Level of blood glucose at 2 h (A) and 24 h (B) after a single dose of insulin administered intraperitoneally. At readministration of insulin on day 2, the RLIP76+/+ blood glucose level goes down. The insulin sensitivity of RLIP76−/− was magnified significantly, with death of all animals before 90 min (C). Blood glucose at the time of death was undetectable. RLIP76+/+, ●; RLIP76−/−, ◇. Pink and blue indicate no insulin; red and purple indicate insulin dosing.
FIG. 2.
FIG. 2.
Glucose tolerance test and lipid levels in RLIP76−/− mice. For the glucose tolerance test, C57B mice (wild-type and RLIP76−/−) were fasted for 6 h followed by oral administration of 2 g/kg body wt glucose using a gavage needle. Each of five groups consisted of five animals each. One group was killed at each time point (0, 5, 30, 60, and 120 min) and ∼200–300 μl of blood was sampled for glucose analyses. Blood was kept refrigerated for ∼4 h and centrifuged at 3,000g for 10 min, and the serum was separated and stored at −20°C until assay. Glucose, cholesterol, and triglycerides measurement was performed in the laboratory of Dr. Kent R. Refsal, Michigan State University. *Statistical analyses by ANOVA were significant at P < 0.001 for RLIP76−/− vs. RLIP76+/+ animals; n = 5.
FIG. 3.
FIG. 3.
Insulin-to-glucose ratio in RLIP76-deficient and -supplemented mice. Twelve-week-old C57BL/6 mice born of heterozygous × heterozygous mating were genotyped by PCR. Insulin and glucose measurement in blood serum was performed on wild-type (RLIP76+/+) animals killed 24 h after a single intraperitoneal injection of control or RLIP76 liposomes equivalent to 200 and 500 μg RLIP76 protein. Insulin and glucose measurement in blood serum was also performed on heterozygous (RLIP76+/−) and homozygous (RLIP76−/−) animals. The values are presented as means ± SD from three separate determinations with three replicates (n = 9) (A and B). Western blot analyses for RLIP76 were performed on liver and heart tissues of RLIP76+/+ male and female mice killed 24 h after administration of 200 or 500 μg RLIP76 protein in the form of liposomes, intraperitoneally. Aliquots of 100 μg detergent-solubilized crude membrane fraction from the liver and heart of animals treated with 200 μg (R2) or 500 μg (R5) were loaded per lane in SDS-PAGE, transblotted, and probed using anti-RLIP76 IgG primary and peroxidase-conjugated goat anti-rabbit IgG secondary antibody. The blots were developed with 4-chloro-1-napthol as chromogenic substrate (A and B insets). β-actin expression was used as loading control. Statistical analyses by ANOVA were significant at P < 0.01 for RLIP76−/− vs. RLIP76+/−, RLIP76−/− vs. RLIP76+/+, RLIP76+/− vs. RLIP76+/+, and RLIP76+/+ vs. RLIP76 proteoliposome–treated RLIP76+/+.
FIG. 4.
FIG. 4.
Hyperinsulinemic-euglycemic and hyperglycemic clamp studies. Glucose and insulin clamp studies were performed as described in the research design and methods section at the Mouse Metabolic Phenotyping Center at the Yale University School of Medicine, with procedures approved by Yale University Institutional Animal Care and Use Committee. Panels A and B demonstrate the result of the hyperinsulinemic-euglycemic clamp study in which blood glucose of both wild-type (○) and RLIP76−/− (◇) animals was maintained at approximately equal levels for the 140-min duration of the study (A); the rate of glucose infusion required to maintain equal blood glucose (B) was significantly greater for the RLIP76−/− animals compared with wild-type controls at all experimental time points. Calculated total body glucose turnover, glycolysis, and hepatic glycogen synthesis (C), and hepatic glucose output in a basal (fasting) as well as hyperglycemic clamp (fed) state (D) are presented. RLIP76+/+ mice, ■; RLIP76−/− mice, formula image
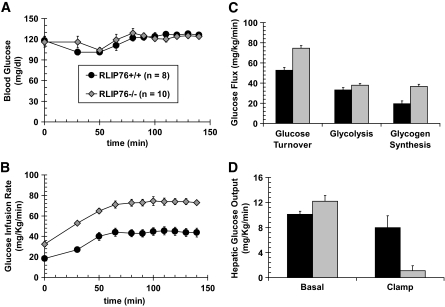
. Statistical analyses by ANOVA were significant at P < 0.05 for RLIP76+/+ vs. RLIP76−/−; n = 8.
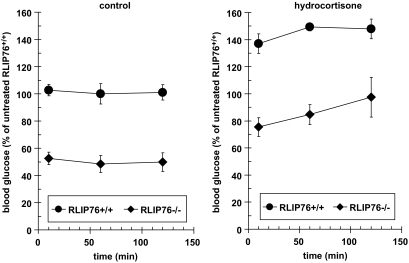
FIG. 5.
FIG. 5.
The effect of hydrocortisone on the blood glucose level of RLIP76+/+ and RLIP76−/− animals. Wild-type and RLIP76 knockout mice were treated with hydrocortisone (1 g/kg body wt) and the blood glucose level was checked in the blood drawn from the tail at different time points from 0 to 120 min. P < 0.01, compared RLIP76+/+ vs. RLIP76−/− animals; n = 5.
FIG. 6.
FIG. 6.
The activity of gluconeogenesis enzymes. The activity of PEPCK (B), F-1,6-BPase (C), and G6Pase (D) was measured in undialyzed and dialyzed liver homogenates of RLIP76+/+ and RLIP76−/− animals. The effect of 4-HNE was also determined on the activity for all three important enzymes of gluconeogenesis (E). The enzyme PEPCK catalyzes the conversion of phosphoenolpyruvate to fructose1,6-biphosphate in a series of steps involving oxidation of NADH to NAD. In this assay, the loss of NADH was determined spectrophotometrically by measuring absorbance at 340 nm, based on the method of Opie and Newsholme (29). For F-1,6-BPase activity, a spectrophotometric-coupled enzyme assay was used based on the method of Taketa and Pogell (30). F-1,6-BPase activity was coupled with phosphoglucose isomerase and NADP-dependent glucose 6-phosphate dehydrogenase, and NADPH formation was measured at 340 nm. G6Pase activity was determined spectrophotometrically using the method of Gierow and Jergil (31). The method is based on a coupled enzyme reaction in which glucose formed is reacted with glucose oxidase and peroxidase, and the quinoneimine formed is a colored product and its formation can be followed spectrophotometrically at 510 nm. The expression of all three enzymes was determined by RT-PCR using their gene-specific primers (A). Either dialyzed or undialyzed, P < 0.01, when compared with RLIP76+/+ vs. RLIP76−/−. RLIP76+/+ or RLIP76−/−, P < 0.07, when compared with undialyzed vs. dialyzed. Means ± SD for three separate experiments, each in triplicate, are shown; n = 9.
FIG. 7.
FIG. 7.
Effect of RLIP76 on insulin internalization. Insulin binding and internalization were studied in RLIP76 MEF+/+ and RLIP76 MEF−/− using FITC-insulin. Cells (0.1 × 10⁶ cells/ml) grown on the sterilized coverslips were incubated with FITC-insulin (100 ng/ml) for 45 min in ice followed by incubation for 10 min at 37°C. Cells were fixed and analyzed by confocal laser microscopy. Photographs taken at identical exposure at ×400 magnification are presented (A). Stress-mediated effect on insulin internalization. RLIP76+/+ and RLIP76−/− MEFs (0.1 × 10⁶ cells/ml) were grown on coverslips, followed by incubation with 50 μmol/l H2O2 for 20 min at 37°C, and were allowed to recover for 2 h. Cells were treated with molar ratio 6:1 of insulin-rhodamine:QD on ice for 45 min, washed, incubated for 10 min at 37°C, and fixed in cold 4% paraformaldehyde. Slides were analyzed using confocal laser-scanning microscopy. Photographs taken at identical exposure at ×400 magnification are presented (B). Effect of RLIP76 on insulin internalization using insulin-QD complexes. Insulin binding and internalization were studied in MEF+/+, MEF−/−, and MEF−/− transfected with empty GFP vector and RLIP76-GFP vector, using insulin-QD complexes. Insulin-QD complexes were formed by incubation of insulin (40 nmol/l; Life Technologies) with QDs 605 ITK amino (PEG; Molecular Probes) at 4°C for 30 min. A molar ratio of 6:1 of insulin:QDs was used. Cells grown on the sterilized coverslips were treated with insulin-QD complexes for 10 min at 37°C. Cells were fixed and analyzed using confocal laser scanning microscopy with Zeiss 510 meta system, with excitation at 594 nm and emission at 610 nm. Photographs taken at identical exposure at ×400 magnification are presented (C). The molecular interactions between the RLIP76 and insulin were checked by FRET analysis as described in the research design and methods section. The FRET analysis clearly indicated that there is no direct interaction of RLIP76 and insulin (D). (A high-quality digital representation of this figure is available in the online issue.)
FIG. 8.
FIG. 8.
Binding of GSH-monochlorobimane and DOX by FRET analysis. Binding of GSH-monochlorobimane (GSH-MCB) and DOX was studied in MEF−/− and MEF−/− transfected with RLIP76-GFP vector. Cells grown on the sterilized coverslips were treated with either 50 μmol/l monochlorobimane or 10 μmol/l DOX and incubated at 37°C for 20 min. Cells were fixed with 4% paraformaldehyde, and FRET and molecular interactions in the cell were analyzed using time-resolved confocal microscope MT 200 (Picoquant) with pulsed diode laser excitations at 405 nm (for MCB donor) and 475 nm (for GFP donor). For MCB observation, 465-nm (10-nm bandwidth) interference filter crossed with 430-nm long path cutoff was used and for GFP observation, 490- to 530-nm interference filter crossed with 500-nm long path filter was used. The top images show the observed intensities for respective samples (A). Below the histogram, the graph presents observed fluorescence lifetime measured for the respective images. For MCB alone (histogram in red), the signal is very bright and fluorescence lifetime is long, as expected, ∼9 ns with the relatively narrow distribution. Addition of RLIP76-GFP results in dramatic shortening of MCB fluorescence lifetime, which dropped to ∼4 ns (histogram in red) (B). The validity of the FRET analysis was confirmed using the fluorescent anthracycline drug, DOX, which is known to bind to RLIP76. C: Lifetime histogram for GFP only (green) and fluorescence of GFP in the presence of DOX (blue). The fluorescence lifetime of GFP in the presence of DOX is shorter, confirming that DOX clearly did interact with the green fluorescence protein of RLIP76. (A high-quality digital representation of this figure is available in the online issue.)
FIG. 9.
FIG. 9.
Regulation of signaling via Hsf-1, Akt, JNK, and FOXO-1 by RLIP76. RLIP76+/+ and RLIP76−/− MEFs were subjected to transfection with pcDNA3.1 empty vector (V) or pcDNA3.1 with full-length RLIP76 cDNA (R) using Lipofectamine (Invitrogen). Crude supernatant of 28,000g of these cells was subjected to Western blot analysis against anti-RLIP76 IgG to demonstrate the absence of RLIP76 antigen in RLIP76−/− MEFs and to show increased RLIP76 protein upon transfection in both RLIP76+/+ and RLIP76−/− MEFs. β-Actin was used as an internal control (A). The effect of RLIP76 overexpression, insulin, or anti-RLIP76 antibody on RLIP76+/+ and RLIP76−/− MEFs on signaling as well as glucose uptake was carried out at 37°C with 5% CO2 atmosphere. The cells were pretreated with either polyclonal rabbit preimmune IgG (C or PIS) or anti-human RLIP76 IgG fractions (AR) (40 μg/ml final concentration) for 1 h. Buffer containing 14C-glucose and either no insulin or 20 mU insulin was added to start the measurement of glucose uptake, and the measurement was terminated at 30 min by washing off the medium with ice-cold PBS and solubilization of cells in counting cocktail. Glucose uptake was measured in 5 × 10⁶ cells, as described previously (36). In parallel experiments in which 14C glucose was omitted, measurements of phosphorylation of Akt, Hsf-1, and JNK, and inactivation of Foxo1, were performed at 30 min. Results of Western blot analyses of Hsf-1 expression and phospho-Akt (Ser473; Millipore, Billerica, MA) are presented. β-actin expression was shown to confirm equal amount of protein was loaded in each sample (B). Results from all groups were analyzed with plots of glucose uptake vs. Hsf-1 expression and Akt activation as well as Foxo-1 inactivation and JNK phosphorylation (measured by ELISA; Active Motif, Carlsbad, CA) (C). Results of all five measurements normalized to the control group (RLIP76+/+ MEFs transfected with empty vector, treated with no insulin and preimmune IgG) are presented (D). Means ± SD for two separate experiments, each in triplicate, are shown; n = 6 (33,36).

References

    1. Tirosh A, Potashnik R, Bashan N, Rudich A: Oxidative stress disrupts insulin-induced cellular redistribution of insulin receptor substrate-1 and phosphatidylinositol 3-kinase in 3T3–L1 adipocytes: a putative cellular mechanism for impaired protein kinase B activation and GLUT4 translocation. J Biol Chem 1999; 274: 10595– 10602 - PubMed
    1. Awasthi S, Singhal SS, Srivastava SK, Zimniak P, Bajpai KK, Saxena M, Sharma R, Ziller SA, 3rd, Frenkel EP, Singh SV: Adenosine triphosphate-dependent transport of doxorubicin, daunomycin, and vinblastine in human tissues by a mechanism distinct from the P-glycoprotein. J Clin Invest 1994; 93: 958– 965 - PMC - PubMed
    1. Yung LM, Leung FP, Yao X, Chen ZY, Huang Y: Reactive oxygen species in vascular wall. Cardiovasc Hematol Disord Drug Targets 2006; 6: 1– 19 - PubMed
    1. Seddon M, Looi YH, Shah AM: Oxidative stress and redox signalling in cardiac hypertrophy and heart failure. Heart 2007; 93: 903– 907 - PMC - PubMed
    1. Ceriello A: Acute hyperglycaemia and oxidative stress generation. Diabet Med 1997; 14( Suppl. 3): S45– S49 - PubMed

Publication types

MeSH terms