. 2010 Mar;59(3):653-61.
doi: 10.2337/db09-1091. Epub 2009 Dec 10.

Insulin gene mutations resulting in early-onset diabetes: marked differences in clinical presentation, metabolic status, and pathogenic effect through endoplasmic reticulum retention

Affiliations

Insulin gene mutations resulting in early-onset diabetes: marked differences in clinical presentation, metabolic status, and pathogenic effect through endoplasmic reticulum retention

Gargi Meur et al. Diabetes. 2010 Mar.

Abstract

Objective: Heterozygous mutations in the human preproinsulin (INS) gene are a cause of nonsyndromic neonatal or early-infancy diabetes. Here, we sought to identify INS mutations associated with maturity-onset diabetes of the young (MODY) or nonautoimmune diabetes in mid-adult life, and to explore the molecular mechanisms involved.

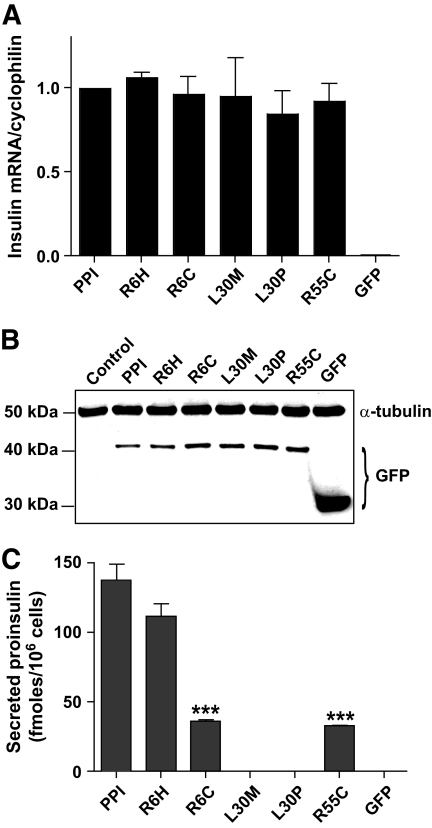
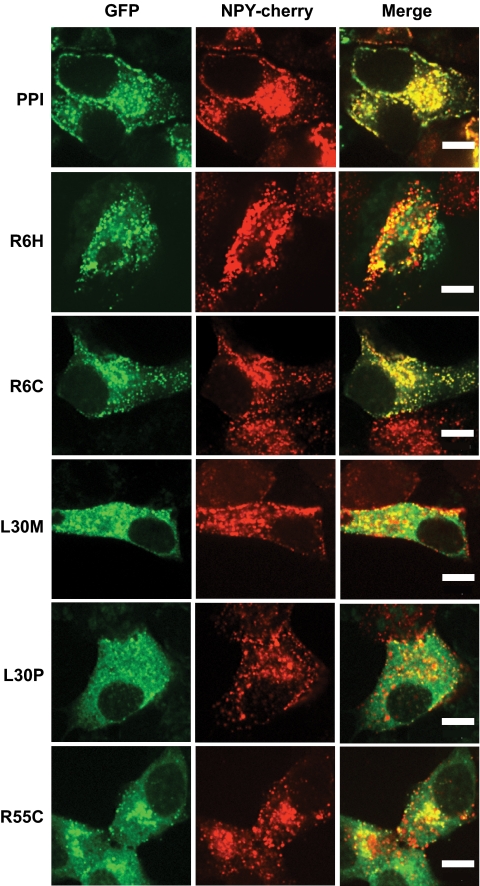
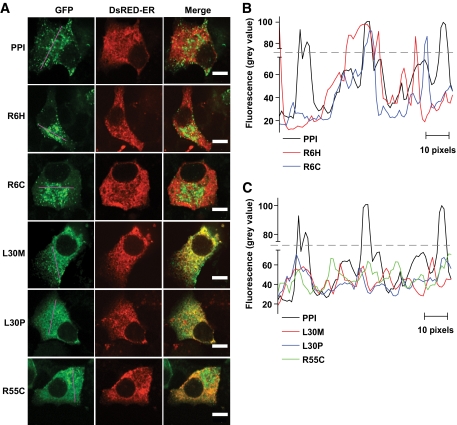
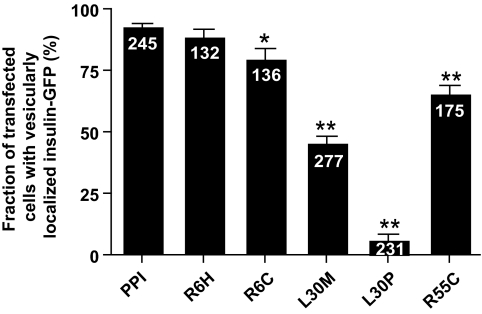
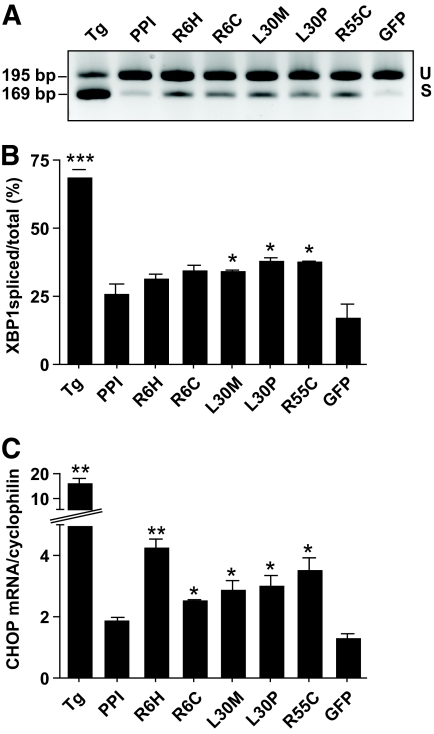
Research design and methods: The INS gene was sequenced in 16 French probands with unexplained MODY, 95 patients with nonautoimmune early-onset diabetes (diagnosed at <35 years) and 292 normoglycemic control subjects of French origin. Three identified insulin mutants were generated by site-directed mutagenesis of cDNA encoding a preproinsulin-green fluorescent protein (GFP) (C-peptide) chimera. Intracellular targeting was assessed in clonal beta-cells by immunocytochemistry and proinsulin secretion, by radioimmunoassay. Spliced XBP1 and C/EBP homologous protein were quantitated by real-time PCR.

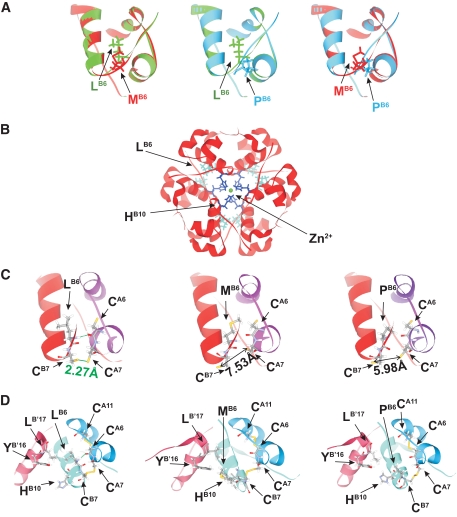
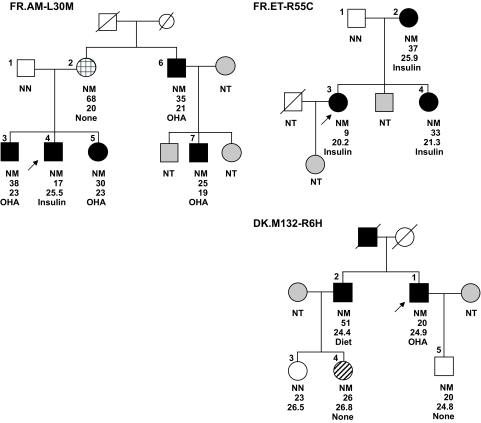
Results: A novel coding mutation, L30M, potentially affecting insulin multimerization, was identified in five diabetic individuals (diabetes onset 17-36 years) in a single family. L30M preproinsulin-GFP fluorescence largely associated with the endoplasmic reticulum (ER) in MIN6 beta-cells, and ER exit was inhibited by approximately 50%. Two additional mutants, R55C (at the B/C junction) and R6H (in the signal peptide), were normally targeted to secretory granules, but nonetheless caused substantial ER stress.

Conclusions: We describe three INS mutations cosegregating with early-onset diabetes whose clinical presentation is compatible with MODY. These led to the production of (pre)proinsulin molecules with markedly different trafficking properties and effects on ER stress, demonstrating a range of molecular defects in the beta-cell.


Figures

FIG. 1.
FIG. 1.
Modeling of mutant insulin. Impact of L30M and L30P mutations on insulin folding (A) and hexamerization (B and C). A: Energy-minimized models of insulin A and B chains, superimposed. (Left) wild type, green; L30M, red; (center) wild type, green, L30P, blue; (right) L30M, red, L30P, blue. Homology models were built using Modeler9v4 software (http://www.salilab.org) using 1mso human insulin structure as a template (30). B: Insulin hexamer showing L30 (LB6) and H34 (HB10) residues and Zn2+ (30). C and D: Close-up showing the impact of L30M (LB6M, center) and L30P (LB6P, right) mutations in insulin B-chain versus wild type (left) showing the increased Cys-Cys distance, disfavoring disulphide bond formation (C), and changes to the structure after disulphide bond formation (D). Leucine at position 6 of the B-chain (L30) interacts with cysteine at position 6 of the A chain and leucine 17 and tryptophan 16 of the neighboring B-chain (B′). L30M and L30P mutations would therefore weaken or eliminate the interactions within the monomer and may also affect hexamer formation.
FIG. 2.
FIG. 2.
Pedigrees of the three probands identified with an INS mutation. The symbols denote the following: solid symbols, diabetes status; striated symbol, impaired glucose tolerance status; empty symbols, normoglycemic subjects; grid symbol, one normal glucose tolerant subject who is carrier of the L30M mutation; and gray symbols, subjects who were not available for genetic testing. Arrows indicate the probands. The INS mutation status is shown under each symbol: NM as heterozygote, NN as wild type, and NT as not tested. The text below indicates the following: age at diagnosis of diabetes or age at examination in normoglycemic subjects (in years), BMI (kg/m2), and treatment in the diabetic subjects.
FIG. 3.
FIG. 3.
Impact of insulin mutations on ER release and secretion in HEK293 cells. A: Real-time PCR measurements of recombinant human INS mRNA expression in transfected HEK293 cells normalized to endogenous cyclophilin (means ± SEM; n ≥ 5). B: Typical Western blot (n ≥ 5) of total protein (30 μg/lane) from HEK293 cells transfected or not with INS constructs separated on 12% reducing SDS-PAGE and probed first with anti-GFP antibody, followed by α-tubulin as loading control. C: Secreted proinsulin content in 1 ml media of transfected HEK293 cells collected for a period of 20 h (means ± SEM; n ≥ 5). No secretion recorded for empty spaces. Data were analyzed by ANOVA with Bonferroni multiple comparison test. ***P < 0.001.
FIG. 4.
FIG. 4.
Subcellular targeting of INS mutants to the dense core secretory vesicles. MIN6 β-cells transfected with mutant INS-GFP constructs were subsequently (typically after 24 h) infected with adenoviral vector expressing NPY-cherry, a dense core vesicle marker. Protein expression after 48 h was studied under ×63 oil-immersion lens of confocal microscope using 488-and 568-nm laser lines. Images shown are of single cells (n ≥ 25) with typical distribution of INS mutant proteins. Note that the R6H panel captured two overlapping cells expressing the R6H mutant in same focal plane, but only the top one expressed NPY-cherry. Scale bar, 7 μm. (A high-quality digital representation of this figure is available in the online issue.)
FIG. 5.
FIG. 5.
ER retention caused by INS mutations and distribution of INS-GFP mutant proteins within single clonal β-cells. A: MIN6 β-cells cotransfected with DsRED-ER, an ER marker along with INS-GFP constructs and protein expression was studied after 48 h, as in Fig. 4. Scale bar, 7 μm. B and C: Green fluorescence was measured (in absolute gray values) across a line drawn through middle section of typical transfected MIN6 cells and the profile plotted against distance in pixels. The gray broken line limits a cutoff fluorescence intensity to differentiate local accumulation of high concentrations of insulin in vesicles compared with diffused appearance across ER. (A high-quality digital representation of this figure is available in the online issue.)
FIG. 6.
FIG. 6.
Quantitation of vesicular targeting of mutant insulin. A representative sample from the population transfected MIN6 β-cells was chosen to count the fraction of cells showing vesicular localization of INS-GFP (as determined by GFP colocalization with red NPY-cherry). Bars represent means ± SEM; n = numbers on bars of total number of cells counted from three separate experiments. Data were analyzed by ANOVA with Bonferroni multiple comparison test. *P < 0.05, **P < 0.001.
FIG. 7.
FIG. 7.
ER stress markers induced by INS mutants. HEK293 cells were either transfected with INS mutants allowing 48 h for protein expression or treated with 100 nmol/l thapsigargin (Tg) for 4 h, and total RNA was extracted. After reverse transcription, 2 μg RNA was amplified either by conventional PCR (100 ng cDNA) or by real-time PCR (20 ng cDNA). A: Typical agarose gel (2%) separated with Tris-borate-EDTA (TBE) buffer showing spliced (S) and unspliced (U) forms of PCR-amplified XBP1 cDNA. B: Quantification of spliced form of XBP1. The gray values of the bands (as in A) of spliced and unspliced XBP1 quantified (means ± SEM; n = 3). C: Real-time quantification of CHOP/GADD153 mRNA normalized to endogenous cyclophilin (means ± SEM; n = 3). All data were analyzed by paired t tests comparing with wild-type INS PPI. *P < 0.05, **P < 0.001.

References

    1. Wang J, Takeuchi T, Tanaka S, Kubo SK, Kayo T, Lu D, Takata K, Koizumi A, Izumi T: A mutation in the insulin 2 gene induces diabetes with severe pancreatic beta-cell dysfunction in the Mody mouse. J Clin Invest 1999; 103: 27– 37 - PMC - PubMed
    1. Ron D: Translational control in the endoplasmic reticulum stress response. J Clin Invest 2002; 110: 1383– 1388 - PMC - PubMed
    1. Herbach N, Rathkolb B, Kemter E, Pichl L, Klaften M, de Angelis MH, Halban PA, Wolf E, Aigner B, Wanke R: Dominant-negative effects of a novel mutated Ins2 allele causes early-onset diabetes and severe beta-cell loss in Munich Ins2C95S mutant mice. Diabetes 2007; 56: 1268– 1276 - PubMed
    1. Shoelson S, Fickova M, Haneda M, Nahum A, Musso G, Kaiser ET, Rubenstein AH, Tager H: Identification of a mutant human insulin predicted to contain a serine-for-phenylalanine substitution. Proc Natl Acad Sci U S A 1983; 80: 7390– 7394 - PMC - PubMed
    1. Shoelson S, Haneda M, Blix P, Nanjo A, Sanke T, Inouye K, Steiner D, Rubenstein A, Tager H: Three mutant insulins in man. Nature 1983; 302: 540– 543 - PubMed

Publication types

MeSH terms