

Identification of targeted analyte clusters for studies of schizophrenia
- PMID: 20007949
- PMCID: PMC2849715
- DOI: 10.1074/mcp.M900372-MCP200
Identification of targeted analyte clusters for studies of schizophrenia
Abstract
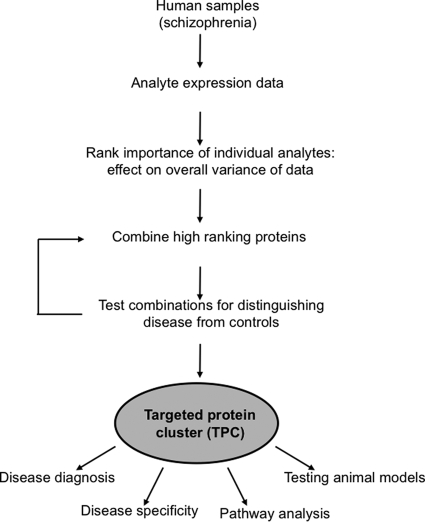
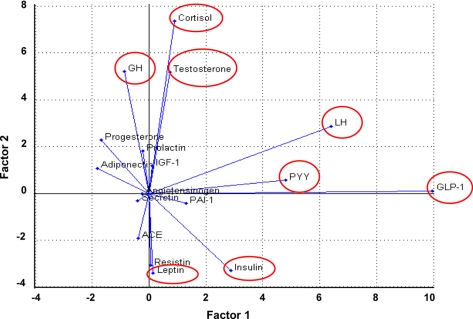
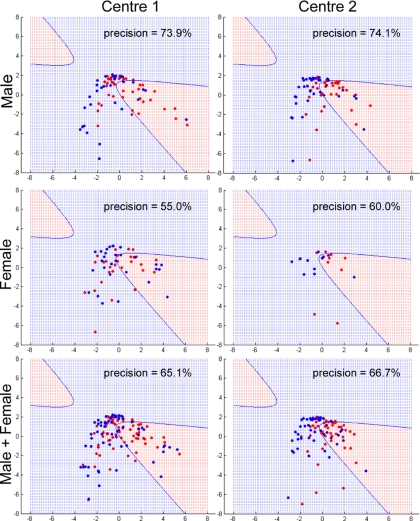
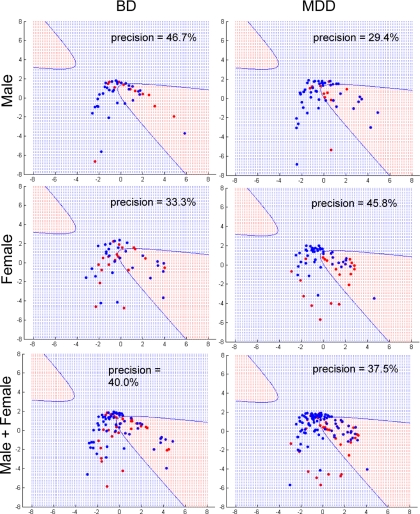
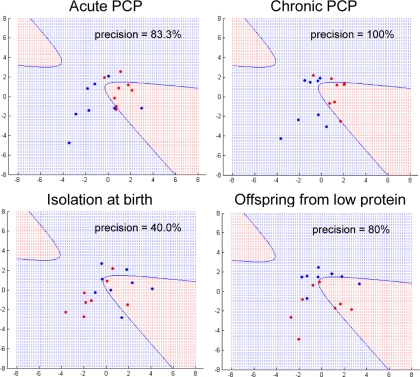
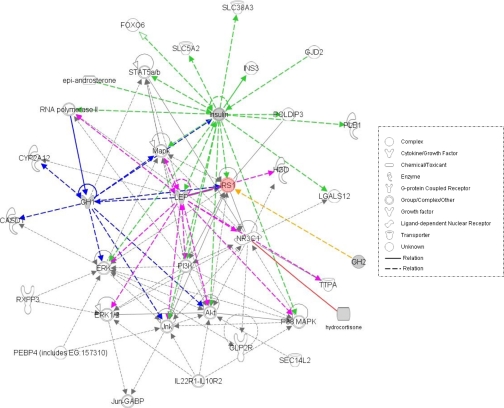
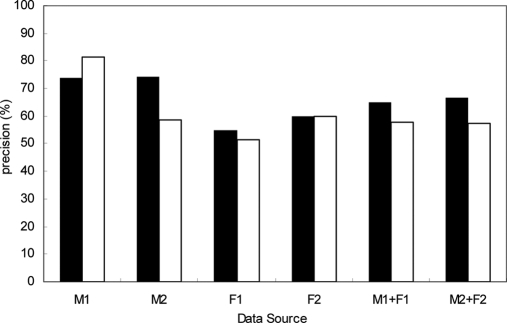
The search for biomarkers to diagnose psychiatric disorders such as schizophrenia has been underway for decades. Many molecular profiling studies in this field have focused on identifying individual marker signals that show significant differences in expression between patients and the normal population. However, signals for multiple analyte combinations that exhibit patterned behaviors have been less exploited. Here, we present a novel approach for identifying biomarkers of schizophrenia using expression of serum analytes from first onset, drug-naïve patients and normal controls. The strength of patterned signals was amplified by analyzing data in reproducing kernel spaces. This resulted in the identification of small sets of analytes referred to as targeted clusters that have discriminative power specifically for schizophrenia in both human and rat models. These clusters were associated with specific molecular signaling pathways and less strongly related to other neuropsychiatric disorders such as major depressive disorder and bipolar disorder. These results shed new light concerning how complex neuropsychiatric diseases behave at the pathway level and demonstrate the power of this approach in identification of disease-specific biomarkers and potential novel therapeutic strategies.
Figures
Similar articles
-
Hippocampal Proteomic and Metabonomic Abnormalities in Neurotransmission, Oxidative Stress, and Apoptotic Pathways in a Chronic Phencyclidine Rat Model.J Proteome Res. 2015 Aug 7;14(8):3174-87. doi: 10.1021/acs.jproteome.5b00105. Epub 2015 Jun 30. J Proteome Res. 2015. PMID: 26043028
-
Identification of a biological signature for schizophrenia in serum.Mol Psychiatry. 2012 May;17(5):494-502. doi: 10.1038/mp.2011.42. Epub 2011 Apr 12. Mol Psychiatry. 2012. PMID: 21483431
-
Decreased plasma levels of neureglin-1 in drug naïve patients and chronic patients with schizophrenia.Neurosci Lett. 2015 Oct 8;606:220-4. doi: 10.1016/j.neulet.2015.09.010. Epub 2015 Sep 10. Neurosci Lett. 2015. PMID: 26365407
-
Metabolomics of Major Depressive Disorder and Bipolar Disorder: Overview and Future Perspective.Adv Clin Chem. 2018;84:81-99. doi: 10.1016/bs.acc.2017.12.005. Epub 2018 Feb 1. Adv Clin Chem. 2018. PMID: 29478517 Review.
-
Analytical approaches for lipidomics and its potential applications in neuropsychiatric disorders.World J Biol Psychiatry. 2017 Oct;18(7):506-520. doi: 10.3109/15622975.2015.1117656. Epub 2016 Jan 26. World J Biol Psychiatry. 2017. PMID: 26555297 Review.
Cited by
-
The methylazoxymethanol acetate (MAM-E17) rat model: molecular and functional effects in the hippocampus.Neuropsychopharmacology. 2012 Jan;37(2):364-77. doi: 10.1038/npp.2011.219. Epub 2011 Sep 28. Neuropsychopharmacology. 2012. PMID: 21956444 Free PMC article.
-
Oxidative stress in schizophrenia: pathogenetic and therapeutic implications.Antioxid Redox Signal. 2011 Oct 1;15(7):1999-2002. doi: 10.1089/ars.2010.3646. Epub 2011 May 4. Antioxid Redox Signal. 2011. PMID: 21194354 Free PMC article.
-
Evidence for disturbed insulin and growth hormone signaling as potential risk factors in the development of schizophrenia.Transl Psychiatry. 2014 Aug 26;4(8):e430. doi: 10.1038/tp.2014.52. Transl Psychiatry. 2014. PMID: 25158005 Free PMC article.
-
Urinary metabolites as a predictive marker for perinatal depression: A secondary analysis of the mothers, Omega-3 & Mental Health Study.Psychiatry Res Commun. 2022 Jun;2(2):100046. doi: 10.1016/j.psycom.2022.100046. Epub 2022 Apr 30. Psychiatry Res Commun. 2022. PMID: 35958051 Free PMC article.
-
Proteomics for blood biomarker exploration of severe mental illness: pitfalls of the past and potential for the future.Transl Psychiatry. 2018 Aug 16;8(1):160. doi: 10.1038/s41398-018-0219-2. Transl Psychiatry. 2018. PMID: 30115926 Free PMC article. Review.
References
-
- Thaker G. K., Carpenter W. T., Jr. (2001) Advances in schizophrenia. Nat. Med 7, 667–671 - PubMed
-
- Csernansky J. G., Schuchart E. K. (2002) Relapse and rehospitalisation rates in patients with schizophrenia: effects of second generation antipsychotics. CNS Drugs 16, 473–484 - PubMed
-
- Möller H. J. (2004) Course and long-term treatment of schizophrenic psychoses. Pharmacopsychiatry 37, 126–135 - PubMed
-
- van Haren N. E., Hulshoff Pol H. E., Schnack H. G., Cahn W., Brans R., Carati I., Rais M., Kahn R. S. (2008) Progressive brain volume loss in schizophrenia over the course of the illness: evidence of maturational abnormalities in early adulthood. Biol. Psychiatry 63, 106–113 - PubMed
-
- van Haren N. E., Hulshoff Pol H. E., Schnack H. G., Cahn W., Mandl R. C., Collins D. L., Evans A. C., Kahn R. S. (2007) Focal gray matter changes in schizophrenia across the course of the illness: a 5-year follow-up study. Neuropsychopharmacology 32, 2057–2066 - PubMed
Publication types
MeSH terms
Substances
LinkOut - more resources
Full Text Sources
Other Literature Sources
Medical
