. 2009 Dec;21(12):3732-48.
doi: 10.1105/tpc.109.066845. Epub 2009 Dec 11.

Dynamic landscapes of four histone modifications during deetiolation in Arabidopsis

Affiliations

Dynamic landscapes of four histone modifications during deetiolation in Arabidopsis

Jean-Benoit F Charron et al. Plant Cell. 2009 Dec.

Abstract

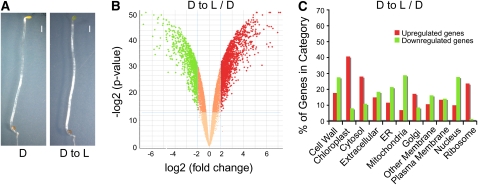
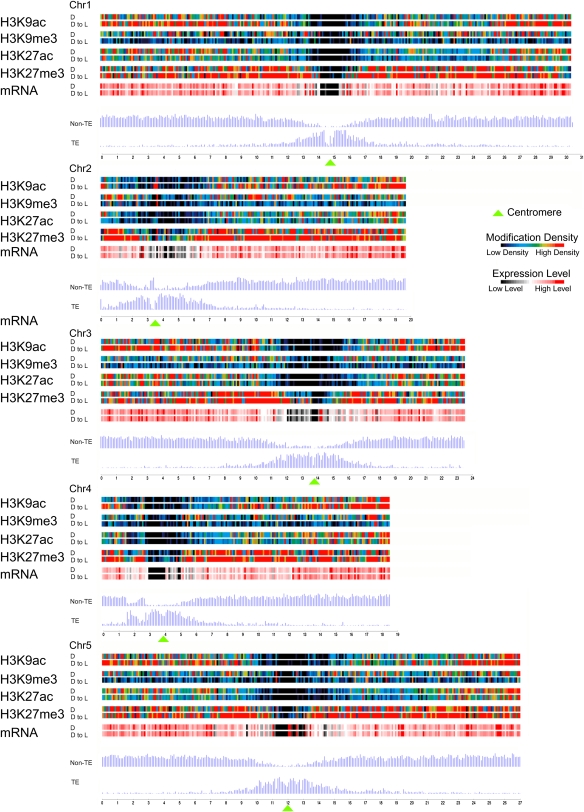
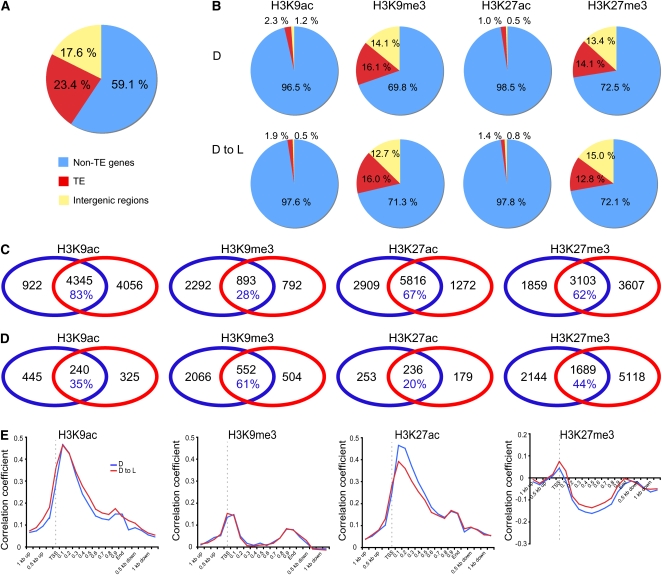
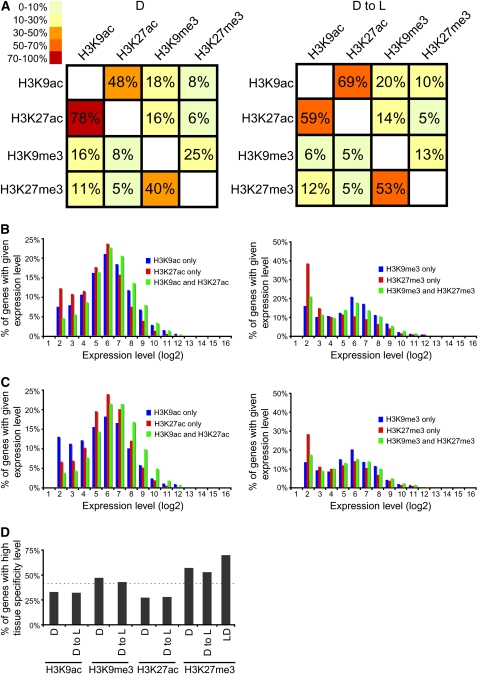
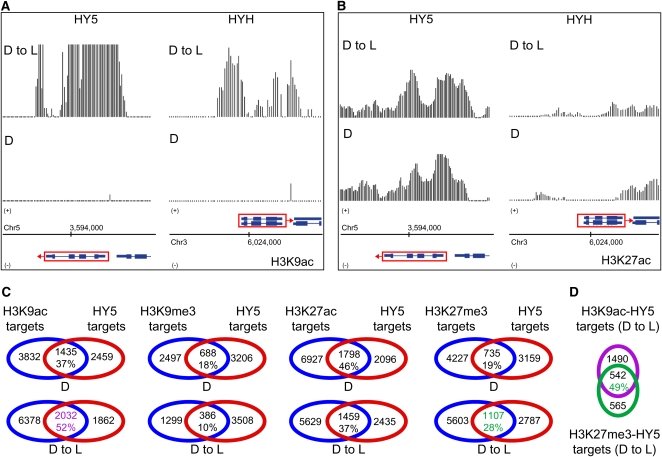
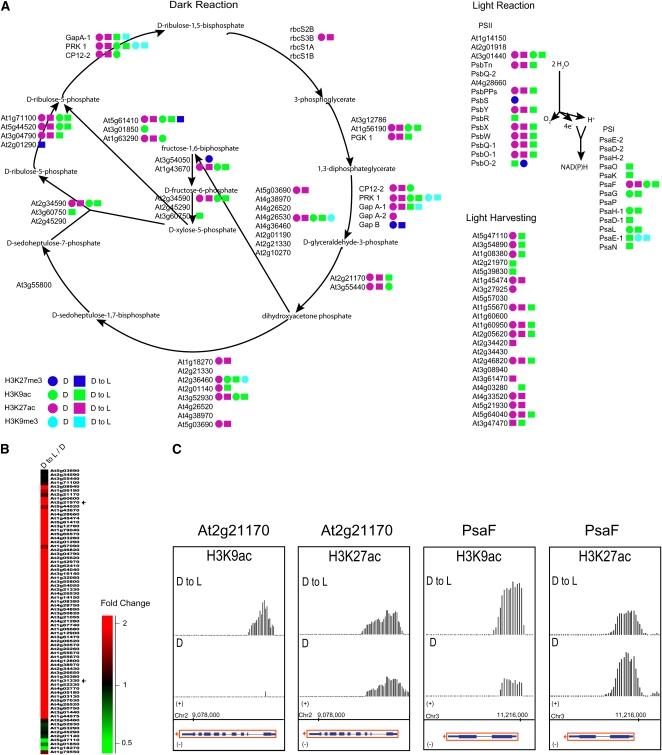
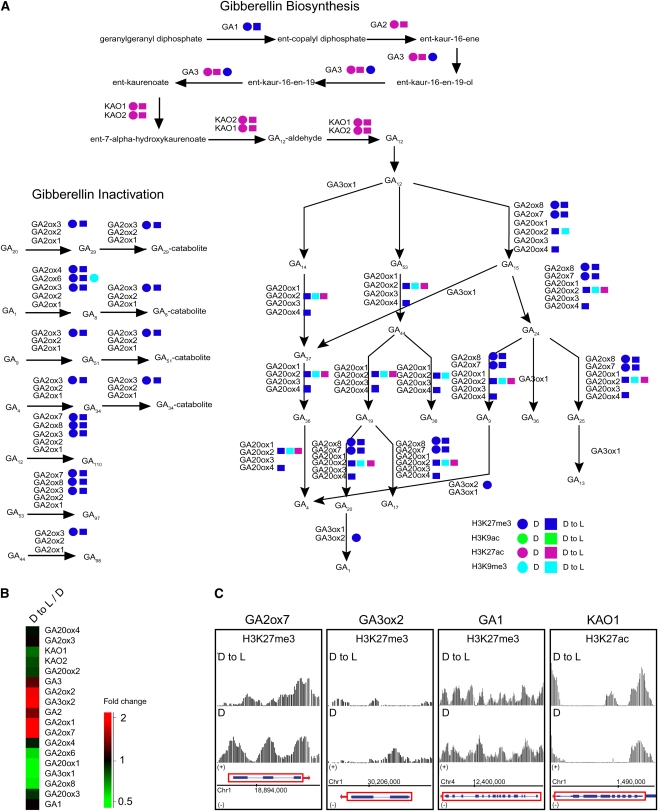
Although landscapes of several histone marks are now available for Arabidopsis thaliana and Oryza sativa, such profiles remain static and do not provide information about dynamic changes of plant epigenomes in response to developmental or environmental cues. Here, we analyzed the effects of light on four histone modifications (acetylation and trimethylation of lysines 9 and 27 on histone H3: H3K9ac, H3K9me3, H3K27ac, and H3K27me3, respectively). Our genome-wide profiling of H3K9ac and H3K27ac revealed that these modifications are nontransposable element gene-specific. By contrast, we found that H3K9me3 and H3K27me3 target nontransposable element genes, but also intergenic regions and transposable elements. Specific light conditions affected the number of modified regions as well as the overall correlation strength between the presence of specific modifications and transcription. Furthermore, we observed that acetylation marks not only ELONGATED HYPOCOTYL5 and HY5-HOMOLOG upon deetiolation, but also their downstream targets. We found that the activation of photosynthetic genes correlates with dynamic acetylation changes in response to light, while H3K27ac and H3K27me3 potentially contribute to light regulation of the gibberellin metabolism. Thus, this work provides a dynamic portrait of the variations in histone modifications in response to the plant's changing light environment and strengthens the concept that histone modifications represent an additional layer of control for light-regulated genes involved in photomorphogenesis.


Figures

Figure 1.
Figure 1.
Light-Regulated Morphological and Genome Expression Changes in Arabidopsis. (A) Phenotypes of wild-type seedlings under dark and light conditions (D, wild-type plants dark grown for 5 d; D to L, wild-type plants dark grown for 4.75 d and transferred to white light for 6 h). Photographs were taken at the same magnification. All seedlings were harvested at the same time of day for analysis. Bars = 1 mm. (B) Volcano plots illustrating the log2 of the fold changes (i.e., the ratio of means for each gene) and inverse significance (i.e., log2-transformed P value) in gene expression differences between dark-grown wild-type seedlings transferred to white light (D to L) and dark-grown wild-type seedlings (D). Genes with statistically different expression (P value < 0.0001) and fold changes above 2 were considered to be induced genes and are shown in red. Genes with statistically different expression (P value < 0.0001) and fold changes below −2 were considered to be repressed genes and are shown in green. (C) Gene Ontology annotation of differentially expressed genes. Upregulated (red bars) and downregulated (green bars) genes were analyzed using WEGO software (Ye et al., 2006). Genes were classified on the basis of cellular components.
Figure 2.
Figure 2.
Genome-Wide Identification of H3K9ac, H3K9me3, H3K27ac, and H3K27me3 Landscapes. Map showing the distribution of histone modifications, expressed genes, and gene (TE and non-TE) density along chromosomes of wild-type Arabidopsis grown in darkness (D) and after transfer to light conditions (D to L). Color-coded bars represent the percentage of probes within each 100-kb bin that were detected for the indicated modification. Average expression level (mRNA) within each bin represents the percentage of signal probes detected in the genome-wide transcription analysis presented in Figure 1. Green triangles mark the position of centromeres within each chromosome.
Figure 3.
Figure 3.
Distribution of Four Histone Modifications in Arabidopsis Genome and Their Relationships with Gene Expression. (A) Frequencies of non-TE genes, TE-related genes, and intergenic regions in Arabidopsis genome based on the TAIR 8.0 release. (B) Frequencies of non-TE genes, TE-related genes, and intergenic regions overlapping with H3K9ac, H3K9me9, H3K27ac, and H3K27me3 regions. (C) Venn diagrams showing the overlap between growth conditions of non-TE genes targeted by H3K9ac, H3K9me9, H3K27ac, and H3K27me3. The percentage values in blue indicate the portion of modified non-TE genes in D seedlings also modified in D to L seedlings. (D) Venn diagrams showing the overlap between growth conditions of TE genes targeted by H3K9ac, H3K9me9, H3K27ac, and H3K27me3. The percentage values in blue indicate the portion of modified TE genes in D seedlings also modified in D to L seedlings. (E) Distribution along genes aligned at their TSSs of Spearman coefficients for correlation of gene expression data and the presence of a modification. The correlation coefficients were calculated in a 200-bp window sliding along the genome with a statistical significance of P < 0.0001.
Figure 4.
Figure 4.
Co-Occurrence and Tissue Specificity Analyses of Histone Modifications. (A) Contingency tables of the occurrence of histone modifications for D seedlings (left panel) and D to L seedlings (right panel). (B) and (C) Association between gene expression levels and the presence of a specified combination of modifications in D (B) or D to L (C) seedlings. The x axes show the expression level (log2) calculated from the analysis presented in Figure 1. The y axes show the percentage of genes in the indicated category containing a specified combination of modifications. (D) Tissue specificity of modified target genes. Tissue specificity measured by Shannon entropy values of genes modified by H3K9ac, H3K9me3, H3K27ac, and H3K27me3 in different growth conditions. Entropy values were calculated on a scale from 0 to 12 (low entropy values = high tissue specificity). Values from 0 to 6 were grouped as genes with high tissue specificity. The dotted line represents a high tissue specificity distribution of all Arabidopsis genes. LD, H3K27me3 target genes previously identified in wild-type plants grown under long-day conditions by Zhang et al. (2007). y axis: percentage of genes with high tissue specificity.
Figure 5.
Figure 5.
Distribution of Histone Modifications within Transcription Factors Involved in Photomorphogenesis. (A) and (B) Signals for H3K9ac (A) and H3K27ac (B) are shown within regions encompassing HY5 and HYH in D seedlings (bottom panel) and D to L seedlings (top panel). A schematic representation of each gene (rectangles = exons and lines = introns) within these regions is shown at the bottom. Red boxes with arrows indicate direction of transcription. Data shown in this figure were corrected for total H3 (nucleosomal DNA). Chromosome coordinates are indicated in base pairs at the bottom. (C) Venn diagrams showing the overlap of non-TE genes targeted by H3K9ac, H3K9me9, H3K27ac, and H3K27me3 with putative HY5 binding sites (Lee et al., 2007) in D and D to L seedlings. The percentage values indicate the portion of modified target genes also modified by HY5 in D and D to L seedlings. The target groups in green and purple are compared in (D). (D) Venn diagrams showing the overlap of H3K9ac-HY5 and H3K27me3-HY5 targets in D to L seedlings. The percentage value indicates the portion of H3K27me3-HY5 target genes also targeted by H3K9ac in D to L seedlings.
Figure 6.
Figure 6.
Photosynthetic Genes Are Acetylated. (A) Diagram of the photosynthesis pathway. Arrows represent enzymatic reactions. Colored circles mark genes targeted by a specific modification in D seedlings. Colored squares mark genes targeted by a specific modification in D to L seedlings. Green = H3K9ac; turquoise = H3K9me3; purple = H3K27ac; blue = H3K27me3. (B) Overview of photosynthesis gene expression by cluster display. D to L/D, dark to light versus dark. The color scale is shown at the bottom. A magnified view of the display is presented in Supplemental Figure 11 online. Arrows indicate the position of the At2g21170 and PsaF genes in the cluster display. (C) Signals for H3K9ac and H3K27ac are shown within regions encompassing At2g21170 and PsaF in D seedlings (bottom panel) and D to L seedlings (top panel). A depiction of each gene (rectangles = exons and lines = introns) within these regions is shown at the bottom. Red boxes with arrows indicate direction of transcription. Data shown in this figure were corrected for total H3 (nucleosomal DNA). Chromosome coordinates are indicated in base pairs at the bottom.
Figure 7.
Figure 7.
H3K27me3 Marks the Gibberellin Biosynthesis and Inactivation Pathways. (A) Diagram of the gibberellin biosynthesis and inactivation pathways. Arrows represent enzymatic reactions. Colored circles mark genes targeted by a specific modification in D seedlings. Colored squares mark genes targeted by a specific modification in D to L seedlings. Green = H3K9ac; turquoise = H3K9me3; purple = H3K27ac; blue = H3K27me3. (B) Cluster display of expression profiles of genes involved in gibberellin metabolism. D to L/D, dark to light versus dark. The color scale is shown at the bottom. (C) Signals for H3K27me3 and H3K27ac are shown within regions encompassing GA2ox7, GA3ox2, and GA1, and KAO1, respectively, in D seedlings (bottom panel) and D to L seedlings (top panel). A schematic representation of each gene (rectangles = exons and lines = introns) within these regions is shown at the bottom. Red boxes with arrows indicate direction of transcription. Data shown in this figure were corrected for total H3 (nucleosomal DNA). Chromosome coordinates are indicated in base pairs at the bottom.

Similar articles

Cited by

References

    1. Alabadi, D., Gallego-Bartolome, J., Orlando, L., Garcia-Carcel, L., Rubio, V., Martinez, C., Frigerio, M., Iglesias-Pedraz, J.M., Espinosa, A., Deng, X.W., and Blazquez, M.A. (2008). Gibberellins modulate light signaling pathways to prevent Arabidopsis seedling de-etiolation in darkness. Plant J. 53 324–335. - PubMed
    1. Ashburner, M., et al. (2000). Gene ontology: Tool for the unification of biology. The Gene Ontology Consortium. Nat. Genet. 25 25–29. - PMC - PubMed
    1. Benhamed, M., Bertrand, C., Servet, C., and Zhou, D.X. (2006). Arabidopsis GCN5, HD1, and TAF1/HAF2 interact to regulate histone acetylation required for light-responsive gene expression. Plant Cell 18 2893–2903. - PMC - PubMed
    1. Benhamed, M., et al. (2008). Genome-scale Arabidopsis promoter array identifies targets of the histone acetyltransferase GCN5. Plant J. 56 493–504. - PubMed
    1. Benjamini, Y., and Hochberg, Y. (1995). Controlling the false discovery rate: A practical and powerful approach to multiple testing. J. R. Stat. Soc., B 57 289–300.

Publication types

MeSH terms