

Use of dansyl-cholestanol as a probe of cholesterol behavior in membranes of living cells
- PMID: 20008119
- PMCID: PMC2853442
- DOI: 10.1194/jlr.M003244
Use of dansyl-cholestanol as a probe of cholesterol behavior in membranes of living cells
Abstract
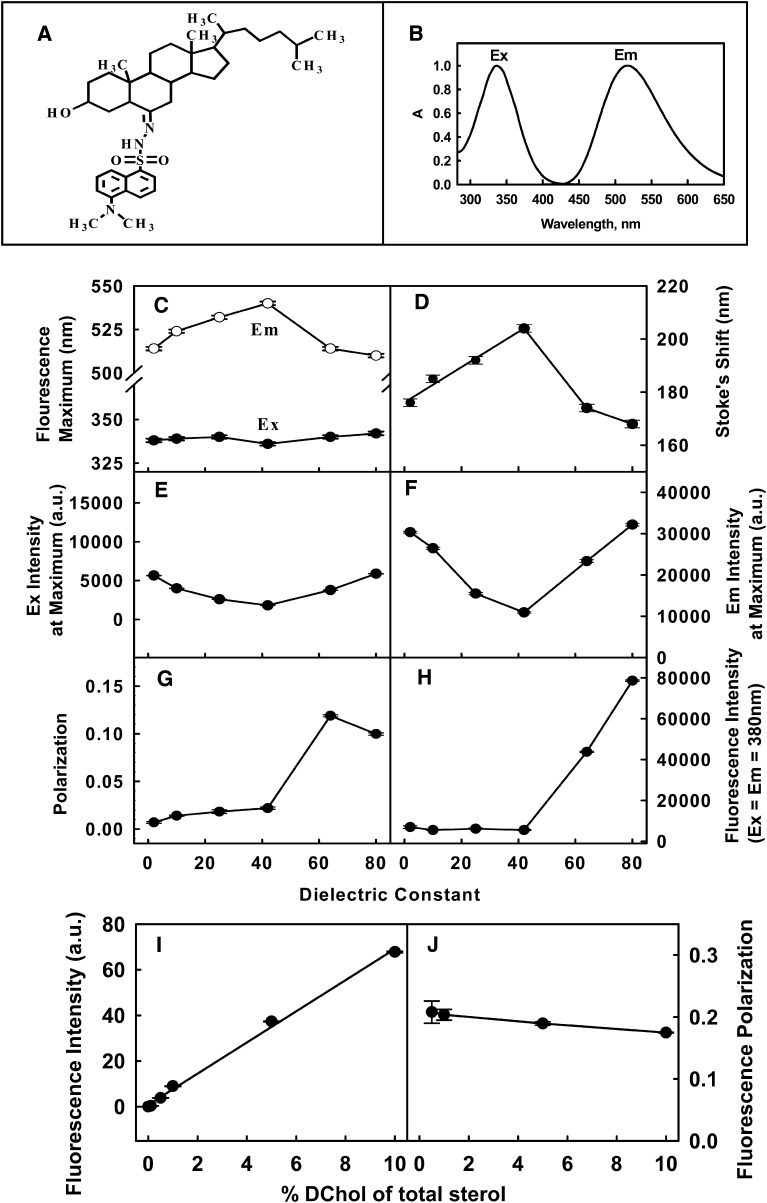
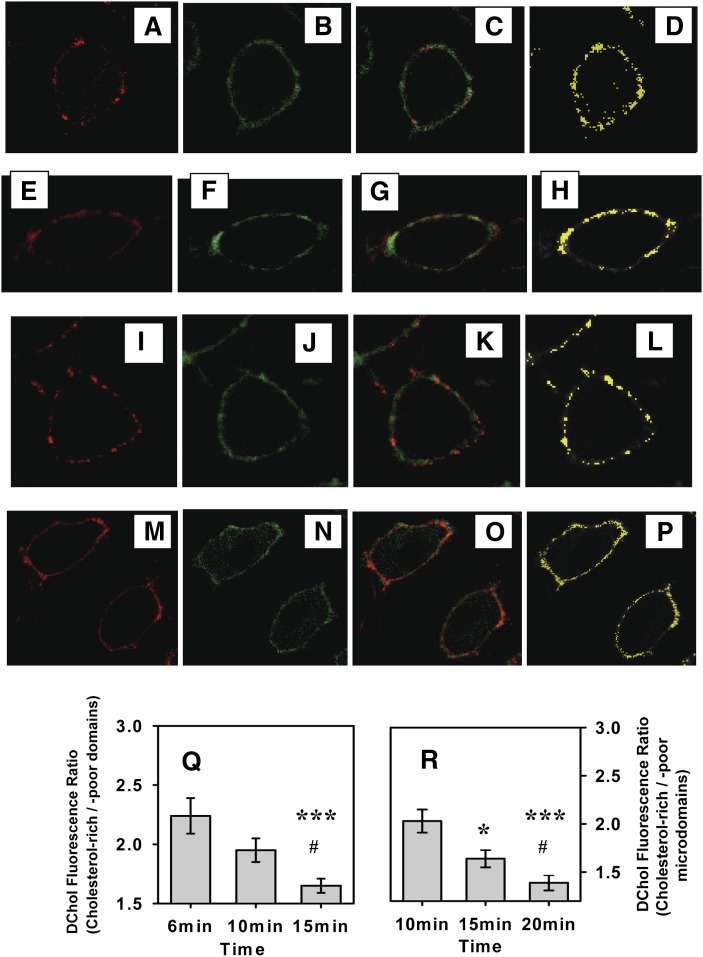
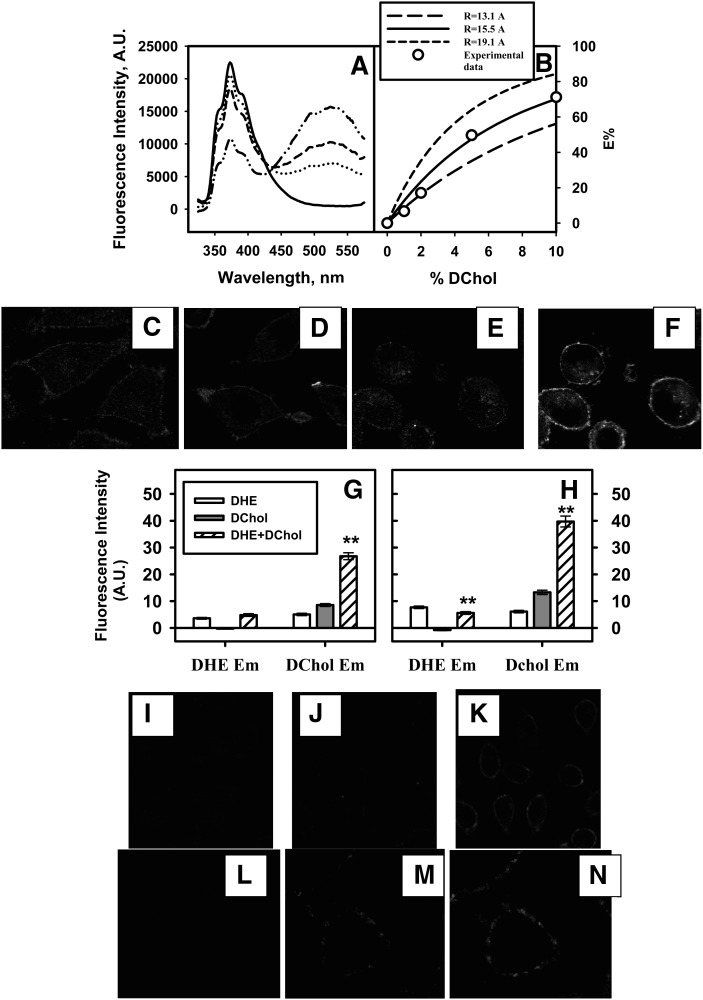
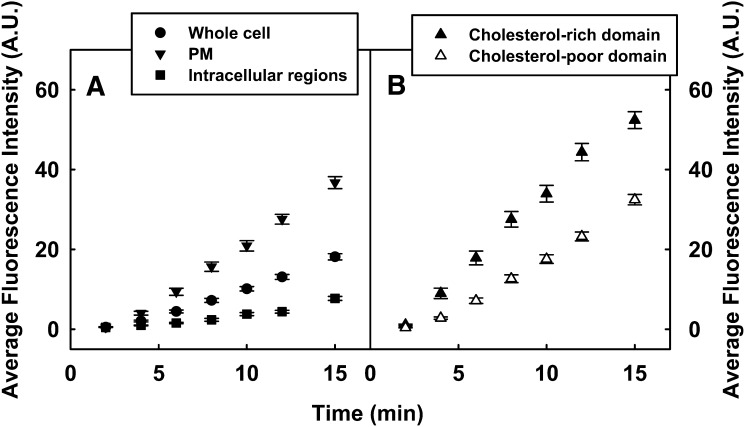
While plasma membrane cholesterol-rich microdomains play a role in cholesterol trafficking, little is known about the appearance and dynamics of cholesterol through these domains in living cells. The fluorescent cholesterol analog 6-dansyl-cholestanol (DChol), its biochemical fractionation, and confocal imaging of L-cell fibroblasts contributed the following new insights: i) fluorescence properties of DChol were sensitive to microenvironment polarity and mobility; (ii) DChol taken up by L-cell fibroblasts was distributed similarly as cholesterol and preferentially into cholesterol-rich vs. -poor microdomains resolved by affinity chromatography of purified plasma membranes; iii) DChol reported similar polarity (dielectric constant near 18) but higher mobility near phospholipid polar head group region for cholesterol in purified cholesterol-rich versus -poor microdomains; and iv) real-time confocal imaging, quantitative colocalization analysis, and fluorescence resonance energy transfer with cholesterol-rich and -poor microdomain markers confirmed that DChol preferentially localized in plasma membrane cholesterol-rich microdomains of living cells. Thus, DChol sensed a unique, relatively more mobile microenvironment for cholesterol in plasma membrane cholesterol-rich microdomains, consistent with the known, more rapid exchange dynamics of cholesterol from cholesterol-rich than -poor microdomains.
Figures
Similar articles
-
Synthesis and characterization of a novel rhodamine labeled cholesterol reporter.Biochim Biophys Acta Biomembr. 2017 Jun;1859(6):1099-1113. doi: 10.1016/j.bbamem.2017.02.018. Epub 2017 Feb 28. Biochim Biophys Acta Biomembr. 2017. PMID: 28257814
-
Transport of plasma membrane-derived cholesterol and the function of Niemann-Pick C1 Protein.FASEB J. 2003 Apr;17(6):782-4. doi: 10.1096/fj.02-0818fje. Epub 2003 Feb 19. FASEB J. 2003. PMID: 12594172
-
Fluorescence and multiphoton imaging resolve unique structural forms of sterol in membranes of living cells.J Biol Chem. 2003 Feb 21;278(8):6384-403. doi: 10.1074/jbc.M205472200. Epub 2002 Nov 26. J Biol Chem. 2003. PMID: 12456684
-
Caveolin, sterol carrier protein-2, membrane cholesterol-rich microdomains and intracellular cholesterol trafficking.Subcell Biochem. 2010;51:279-318. doi: 10.1007/978-90-481-8622-8_10. Subcell Biochem. 2010. PMID: 20213548 Review.
-
Cholesterol and the interaction of proteins with membrane domains.Prog Lipid Res. 2006 Jul;45(4):279-94. doi: 10.1016/j.plipres.2006.02.001. Epub 2006 Mar 20. Prog Lipid Res. 2006. PMID: 16574236 Review.
Cited by
-
Analysis of cholesterol trafficking with fluorescent probes.Methods Cell Biol. 2012;108:367-93. doi: 10.1016/B978-0-12-386487-1.00017-1. Methods Cell Biol. 2012. PMID: 22325611 Free PMC article.
-
Fluorescence microscopy imaging of a neurotransmitter receptor and its cell membrane lipid milieu.Front Mol Biosci. 2022 Nov 28;9:1014659. doi: 10.3389/fmolb.2022.1014659. eCollection 2022. Front Mol Biosci. 2022. PMID: 36518846 Free PMC article. Review.
-
Hepatitis C Virus Selectively Alters the Intracellular Localization of Desmosterol.ACS Chem Biol. 2016 Jul 15;11(7):1827-33. doi: 10.1021/acschembio.6b00324. Epub 2016 May 6. ACS Chem Biol. 2016. PMID: 27128812 Free PMC article.
-
Fluorescent Sterols and Cholesteryl Esters as Probes for Intracellular Cholesterol Transport.Lipid Insights. 2016 Jun 9;8(Suppl 1):95-114. doi: 10.4137/LPI.S31617. eCollection 2015. Lipid Insights. 2016. PMID: 27330304 Free PMC article. Review.
-
Lipid Metabolism and Immune Function: Chemical Tools for Insights into T-Cell Biology.Chembiochem. 2025 Jun 3;26(11):e202400980. doi: 10.1002/cbic.202400980. Epub 2025 Apr 16. Chembiochem. 2025. PMID: 40162512 Free PMC article. Review.
References
-
- Schroeder F., Nemecz G. 1990. Transmembrane cholesterol distribution. Advances in Cholesterol Research. Esfahami M., Swaney J., Telford Press, Caldwell, NJ: 47–87.
-
- Schroeder F., Frolov A. A., Murphy E. J., Atshaves B. P., Jefferson J. R., Pu L., Wood W. G., Foxworth W. B., Kier A. B. 1996. Recent advances in membrane cholesterol domain dynamics and intracellular cholesterol trafficking. Proc. Soc. Exp. Biol. Med. 213: 150–177. - PubMed
-
- Pike L. J. 2006. Rafts defined: a report on the Keystone symposium on lipid rafts and cell function. J. Lipid Res. 47: 1597–1598. - PubMed
-
- Brown D. A., London E. 2000. Structure and function of sphingolipid- and cholesterol-rich membrane rafts. J. Biol. Chem. 275: 17221–17224. - PubMed
Publication types
MeSH terms
Substances
Grants and funding
LinkOut - more resources
Full Text Sources
Medical
