. 2010 Jan;176(1):177-86.
doi: 10.2353/ajpath.2010.090672. Epub 2009 Dec 11.

Tissue factor-deficiency and protease activated receptor-1-deficiency reduce inflammation elicited by diet-induced steatohepatitis in mice

Affiliations

Tissue factor-deficiency and protease activated receptor-1-deficiency reduce inflammation elicited by diet-induced steatohepatitis in mice

James P Luyendyk et al. Am J Pathol. 2010 Jan.

Abstract

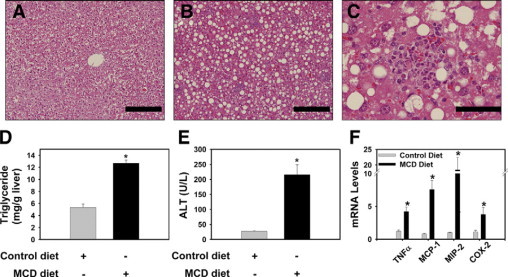
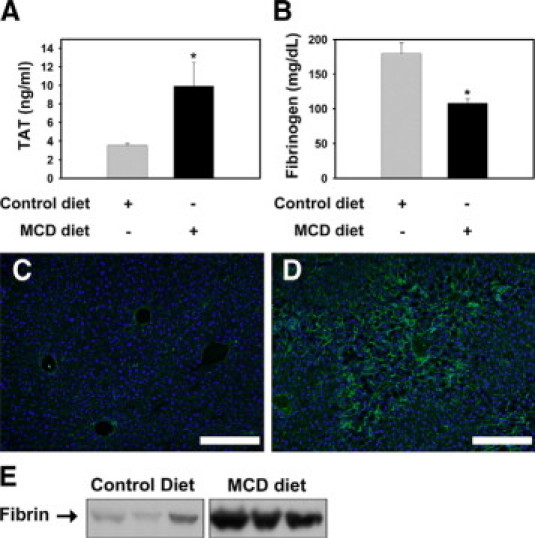
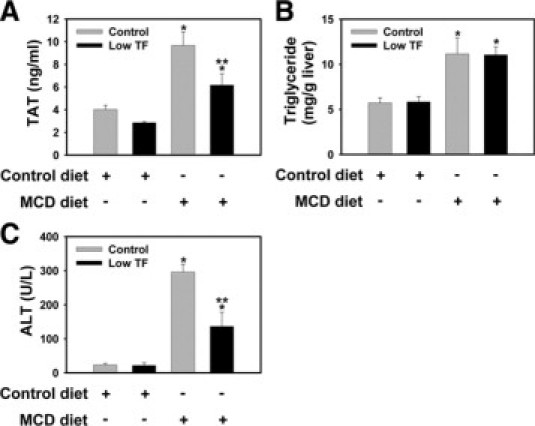
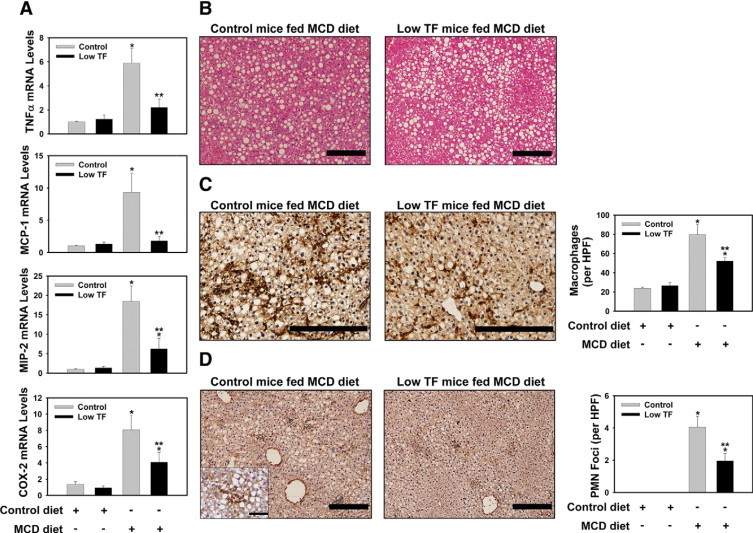
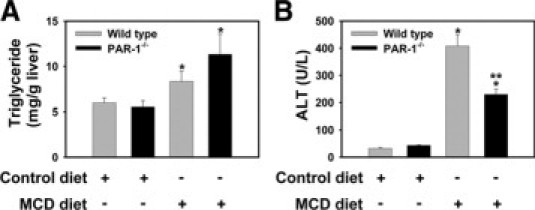
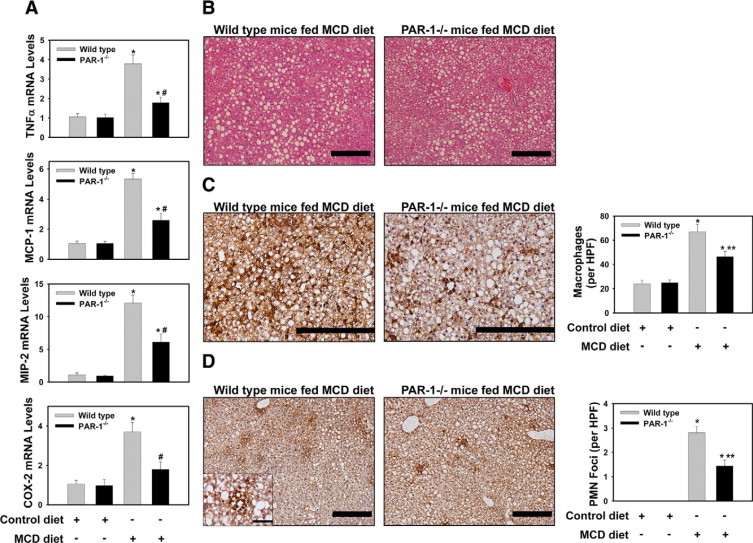
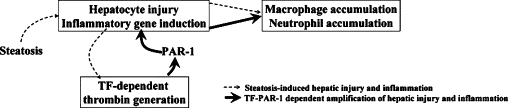
Altered hepatic lipid homeostasis, hepatocellular injury, and inflammation are features of nonalcoholic steatohepatitis, which contributes significantly to liver-related morbidity and mortality in the Western population. A collection of inflammatory mediators have been implicated in the pathogenesis of steatohepatitis in mouse models. However, the pathways essential for coordination and amplification of hepatic inflammation and injury caused by steatosis are not completely understood. We tested the hypothesis that tissue factor (TF)-dependent thrombin generation and the thrombin receptor protease activated receptor-1 (PAR-1) contribute to liver inflammation induced by steatosis in mice. Wild-type C57Bl/6J mice fed a diet deficient in methionine and choline for 2 weeks manifested steatohepatitis characterized by increased serum alanine aminotransferase activity, macrovesicular hepatic steatosis, hepatic inflammatory gene expression, and lobular inflammation. Steatohepatitis progression was associated with thrombin generation and hepatic fibrin deposition. Coagulation cascade activation was significantly reduced in low TF mice, which express 1% of normal TF levels. Hepatic triglyceride accumulation was not affected in low TF mice or PAR-1-deficient mice. In contrast, biomarkers of hepatocellular injury, inflammatory gene induction, and hepatic accumulation of macrophages and neutrophils were greatly reduced by TF-deficiency and PAR-1-deficiency. The results suggest that TF-dependent thrombin generation and activation of PAR-1 amplify hepatic inflammation and injury during the pathogenesis of steatohepatitis.


Figures

Figure 1
Figure 1
MCD diet-induced steatohepatitis in wild-type mice. Wild-type congenic C57Bl/6J mice were fed either control diet or MCD diet for 14 days. A: Representative photomicrograph of H&E-stained liver section from a mouse fed control diet showing normal hepatic architecture and glycogen accumulation. B: Representative photomicrograph of H&E-stained liver section from a mouse fed the MCD diet showing substantial macrovesicular hepatic steatosis and marked focal inflammatory cell accumulation. For (A−B), scale bar = 20 μm. C: Representative photomicrograph showing a typical foci of inflammatory cells in a liver from a mouse fed the MCD diet. For (C), scale bar = 5 μm. Hepatic triglyceride levels (D), serum ALT activity (E), and hepatic levels of inflammatory gene mRNAs (F) were determined. Data are expressed as mean ± SEM. n = 4 to 5 mice per group. Significantly different from mice fed the control diet, *P < 0.05.
Figure 2
Figure 2
Procoagulant response associated with MCD diet-induced steatohepatitis in wild-type mice. A: Plasma thrombin-antithrombin (TAT) and (B) fibrinogen levels were determined in wild-type congenic C57BL/6J mice fed control diet or MCD diet for 14 days. Data are expressed as mean ± SEM, n = 5 to 9 mice per group. Significantly different from mice fed the control diet, *P < 0.05. Representative photomicrographs showing fibrin staining (green) in liver sections counterstained with 4,6-diamidino-2-phenylindole from mice fed control diet (C) or the MCD diet (D). Scale bar = 20 μm. E: Representative Western blot showing fibrin levels in liver extracts determined using the 59D8 monoclonal antibody. The bands shown were scanned digitally from the same film.
Figure 3
Figure 3
Effect of TF-deficiency on thrombin generation, hepatocellular injury, and hepatic triglyceride accumulation in MCD diet-induced steatohepatitis. Heterozygous control mice (mTF+/−hTF+ mice) and low TF mice (mTF−/−hTF+ mice) (see Materials and Methods) were fed control diet or the MCD diet for 14 days. A: Plasma thrombin-antithrombin (TAT) levels. B: Hepatic triglyceride levels. C: Serum alanine aminotransferase (ALT) activity. n = 5 to 11 mice per group. Data are expressed as mean ± SEM. Significantly different from the same mice fed control diet, *P < 0.05. Significantly different from heterozygous control mice fed the MCD diet, **P < 0.05.
Figure 4
Figure 4
Effect of TF-deficiency on MCD diet-induced hepatic pro-inflammatory gene expression and inflammatory cell accumulation. Heterozygous control mice (mTF+/-hTF+ mice) and low TF mice (mTF−/−hTF+ mice) (see Materials and Methods) were fed control diet or the MCD diet for 14 days. Total RNA was isolated from whole liver. The levels of (A) TNFα mRNA, MCP-1 mRNA, MIP-2 mRNA, and COX-2 mRNA were determined by real-time PCR. B: Representative photomicrographs showing H&E-stained liver sections from a heterozygous control mouse and low TF mouse fed the MCD diet. Scale bar = 20 μm. C: Representative photomicrographs showing combined F4/80 and CD68 immunohistochemical staining for macrophages (dark brown) in liver sections from a heterozygous control mouse and low TF mouse fed the MCD diet. The average number of macrophages per ×400 field was determined. Scale bar = 20 μm. D: Representative photomicrographs showing immunohistochemical staining for neutrophils (dark brown) in liver sections from a heterozygous control mouse and low TF mouse fed the MCD diet. Scale bar = 20 μm. The high magnification (×1000) inset shows a representative neutrophil foci. For the inset, Scale bar = 5 μm. (The average number of neutrophil foci (>5 clustered neutrophils) per ×200 field was determined. n = 5 to 11 mice per group. Data are expressed as mean ± SEM. Significantly different from the same mice fed control diet, *P < 0.05. Significantly different from heterozygous control mice fed the MCD diet, **P < 0.05.
Figure 5
Figure 5
Effect of PAR-1-deficiency on hepatocellular injury and hepatic triglyceride accumulation in MCD diet-induced steatohepatitis. Wild-type control mice (PAR-1+/+ mice) and PAR-1−/− mice (see Materials and Methods) were fed control diet or the MCD diet for 14 days. A: Hepatic triglyceride levels. B: Serum alanine aminotransferase (ALT) activity. n = 4 to 11 mice per group. Data are expressed as mean ± SEM. Significantly different from the same mice fed control diet, *P < 0.05. Significantly different from wild-type control mice fed the MCD diet, **P < 0.05.
Figure 6
Figure 6
Effect of PAR-1 deficiency on MCD diet-induced hepatic pro-inflammatory gene expression and inflammatory cell accumulation. Wild-type control mice (PAR-1+/+ mice) and PAR-1−/− mice (see Materials and Methods) were fed control diet or the MCD diet for 14 days. Total RNA was isolated from whole liver. The levels of (A) TNFα mRNA, MCP-1 mRNA, MIP-2 mRNA, and COX-2 mRNA were determined by real-time PCR. (B) Representative photomicrographs showing H&E-stained liver sections from a wild-type control mouse and PAR-1−/− mouse fed the MCD diet. Scale bar = 20 μm. C: Representative photomicrographs showing combined F4/80 and CD68 immunohistochemical staining for macrophages (dark brown) in liver sections from a wild-type control mouse and PAR-1−/− mouse fed the MCD diet. Scale bar = 20 μm. The average number of macrophages per 400X field was determined. D: Representative photomicrographs showing immunohistochemical staining for neutrophils (dark brown) in liver sections from a wild-type control mouse and PAR-1−/− mouse fed the MCD diet. Scale bar = 20 μm. The high magnification (×1000) inset shows a representative neutrophil foci. For the inset, the scale bar = 5 μm. The average number of neutrophil foci (>5 clustered neutrophils) per ×200 field was determined. n = 5 to 11 mice per group. Data are expressed as mean ± SEM. Significantly different from the same mice fed control diet, *P < 0.05. Significantly different from wild-type control mice fed the MCD diet, **P < 0.05.
Figure 7
Figure 7
Proposed mechanism of TF−PAR-1-dependent amplification of hepatocellular injury and inflammation during steatohepatitis. Hepatic lipid accumulation induces modest hepatocyte injury and inflammation that induce TF-dependent coagulation cascade activation and thrombin generation in the liver sinusoids. Thrombin cleaves and activates PAR-1 expressed by nonparenchymal cells, which amplifies expression of numerous pro-inflammatory genes and promotes exaggerated inflammatory cell accumulation and hepatic injury.

Similar articles

Cited by

References

    1. Clark JM, Brancati FL, Diehl AM. Nonalcoholic fatty liver disease. Gastroenterology. 2002;122:1649–1657. - PubMed
    1. Larter CZ, Yeh MM. Animal models of NASH: getting both pathology and metabolic context right. J Gastroenterol Hepatol. 2008;23:1635–1648. - PubMed
    1. Farrell GC, Larter CZ. Nonalcoholic fatty liver disease: from steatosis to cirrhosis. Hepatology. 2006;43:S99–S112. - PubMed
    1. Kleiner DE, Brunt EM, Van NM, Behling C, Contos MJ, Cummings OW, Ferrell LD, Liu YC, Torbenson MS, Unalp-Arida A, Yeh M, McCullough AJ, Sanyal AJ. Design and validation of a histological scoring system for nonalcoholic fatty liver disease. Hepatology. 2005;41:1313–1321. - PubMed
    1. Friedman SL. Mechanisms of hepatic fibrogenesis. Gastroenterology. 2008;134:1655–1669. - PMC - PubMed

Publication types

MeSH terms