. 2010 Jan;176(1):40-50.
doi: 10.2353/ajpath.2010.090146. Epub 2009 Dec 11.

The absence of interleukin-6 enhanced arsenite-induced renal injury by promoting autophagy of tubular epithelial cells with aberrant extracellular signal-regulated kinase activation

Affiliations

The absence of interleukin-6 enhanced arsenite-induced renal injury by promoting autophagy of tubular epithelial cells with aberrant extracellular signal-regulated kinase activation

Akihiko Kimura et al. Am J Pathol. 2010 Jan.

Abstract

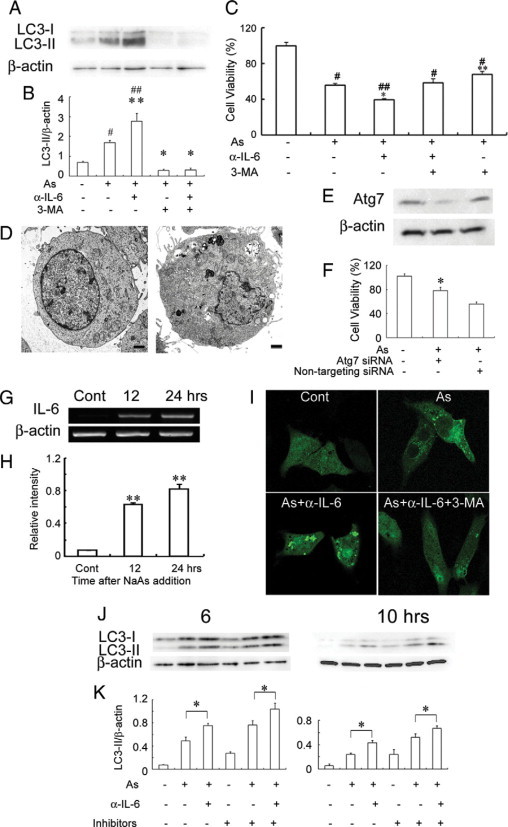
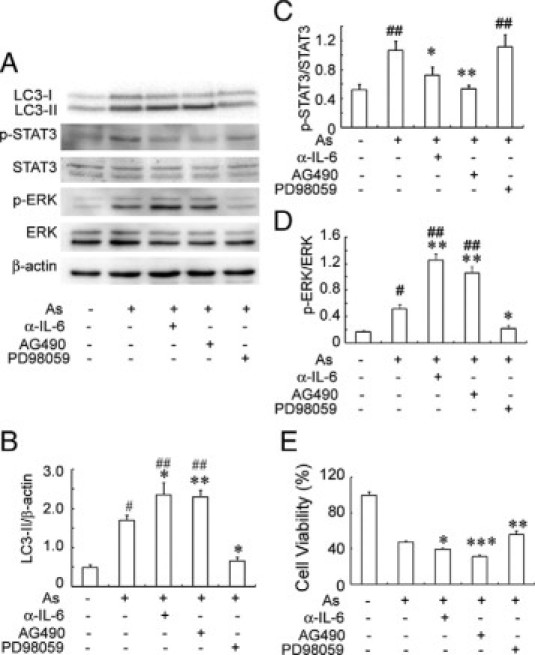
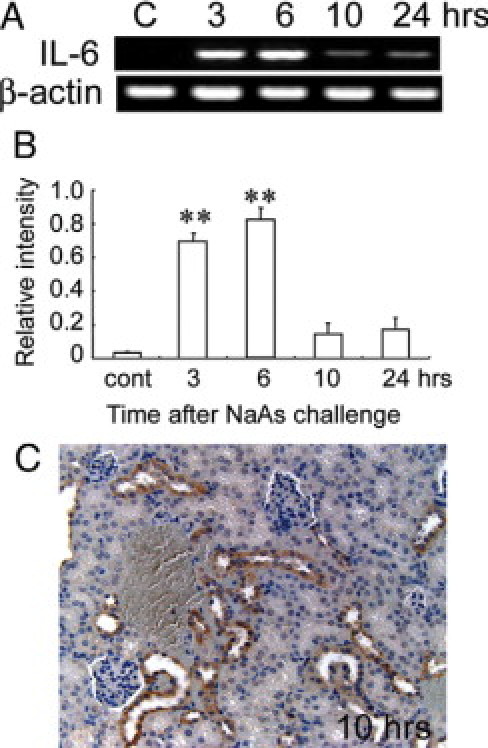
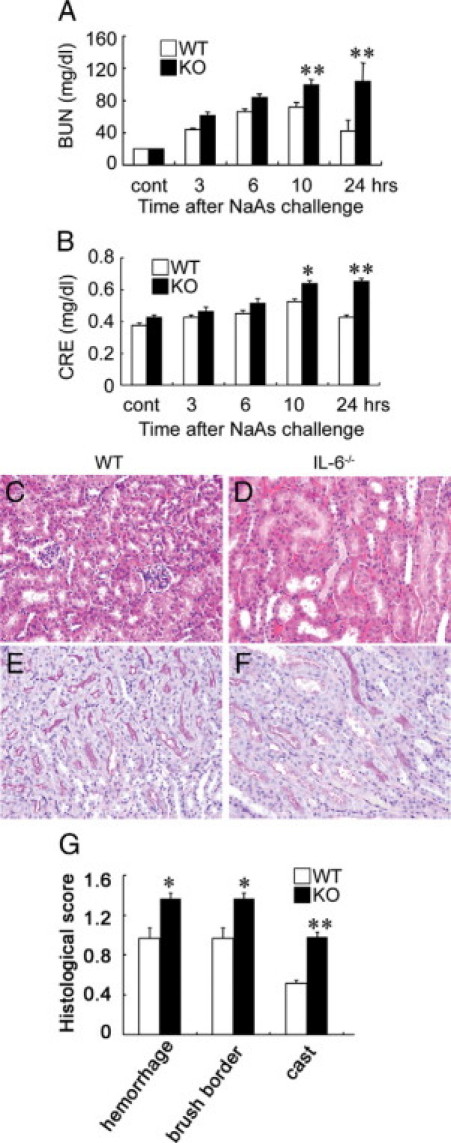
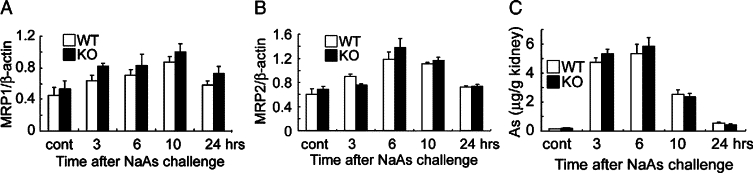
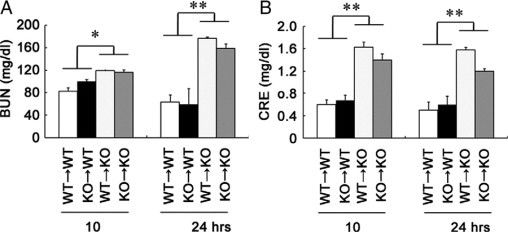
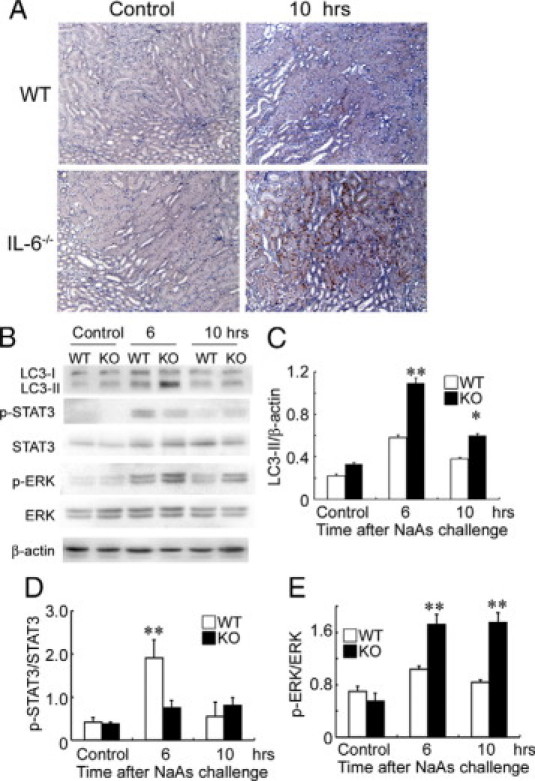
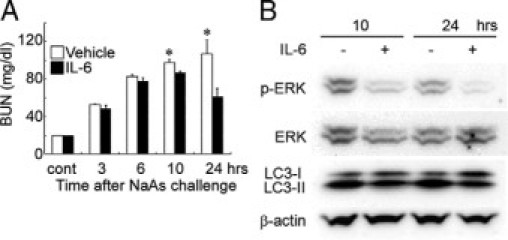
Sodium arsenite (NaAs)-induced autophagic cell death (ACD) of a mouse renal tubular epithelial cell line (mProx24), which expresses enhanced levels of interleukin-6 (IL-6), was reduced by the suppression of autophagy by 3-methyladenine or Atg7 knockdown. The inhibition of the IL-6/signal transducer and activator of transcription 3 (STAT3) signal pathway by anti-IL-6 antibody or a Jak2 inhibitor (AG490) exaggerated ACD of mProx24 cells after NaAs challenge, attenuating STAT3 activation and reciprocally enhancing extracellular signal-regulated kinase (ERK) phosphorylation. In contrast, an ERK inhibitor, PD98059, reduced NaAs-induced ACD in mProx24 cells. Subcutaneous injection of NaAs (12.5 mg/kg) into BALB/c (wild-type) mice enhanced intrarenal expression of IL-6, mainly produced by tubular cells, and caused severe renal injury characterized by hemorrhages, acute tubular necrosis, cast formation, and brush border disappearance, with increases in serum urea nitrogen (blood urea nitrogen) and creatinine levels. In addition, IL-6-deficient (IL-6(-/-)) mice exhibited exaggerated histopathological changes with higher blood urea nitrogen and creatinine levels. Moreover, in IL-6(-/-) mice treated with NaAs, ACD in renal tubular cells was significantly augmented, along with diminished STAT3 activation and reciprocal enhancement of ERK signaling, compared with wild-type mice. Finally, the administration of exogenous IL-6 into wild-type mice significantly reduced NaAs-induced ACD along with diminished ERK activation and eventually alleviated acute renal dysfunction. Thus, IL-6/STAT3 signal pathway could inhibit ERK activation, a crucial step for ACD, eventually attenuating NaAs-induced renal dysfunction.


Figures

Figure 1
Figure 1
A and B: Effects of anti-IL-6 pAbs and 3-MA on NaAs-induced conversion of LC3-I to LC3-II in mProx24 cells after 12 hours of culture. Western blotting analyses were performed as described in Materials and Methods. Representative results from six independent experiments are shown in A. B: LC3-II/β-actin levels were densitometrically determined. All values represent means ± SEM (six independent experiments). **P < 0.01; *P < 0.05, versus mProx24 cells cultured with only NaAs. #P < 0.01; ##P < 0.05, versus untreated mProx24 cells. C: Effects of anti-IL-6 pAbs and 3-MA on the viability of mProx24 cells cultured with NaAs for 12 hours. All values represent means ± SEM (n = 16 wells). ##P < 0.01; #P < 0.05, versus control. **P < 0.01; *P < 0.05, versus cultured with only NaAs. D: The ultrastructure of untreated and NaAs-treated mProx24 cells (left: untreated; right: NaAs-treated). Numerous autophagic vacuoles were detected in NaAs-treated mProx 24 cells. Representative results from three independent experiments is shown here (bars = 1 μm). E: The effects of siRNA treatment on Atg7 expression. mProx24 cells were transfected with Atg7 siRNA or nontargeting control siRNA. Whole-cell lystes were subjected to Western blotting with anti-Atg7 pAbs. F: Effects of Atg7 knockdown on viability of mProx24 cell cultured with NaAs for 12 hours. All values represent means ± SEM (n = 6 wells). *P < 0.05, versus nontargeting siRNA trasfected mProx24 cells. G and H: RT-PCR analysis for IL-6 gene expression in mProx24 cells cultured in the presence of NaAs. Representative results from six independent experiments are shown in G. The ratios of IL-6 to β-actin are calculated and shown in H. All values represent means ± SEM (n = 6 independent experiments). **P < 0.01, versus control. I: Fluorescence microscopic determination of GFP-LC3 distributions in mProx24 cells treated with NaAs, NaAs+anti-IL-6 pAbs, or NaAs+anti-IL-6 pAbs + 3-MA for 12 hours. Representative results from six independent experiments are shown here. J and K: Effects of E64d and pepstatin A on NaAs-induced conversion of LC3-I to LC3-II in mProx24 cells. NaAs-induced LC3-II formation in mProx24 cells cultured in the presence or absence of E64d and pepstatin A were analyzed as described in Materials and Methods. Representative results from six independent experiments are shown in J. LC3-II/β-actin ratios were densitometrically determined and shown in K. All values represent means ± SEM (six independent experiments). *P < 0.05.
Figure 2
Figure 2
A: Effects of anti-IL-6 pAbs, AG490, and PD98059 on NaAs-induced autophagic cell death and the phosphorylation of STAT3 and ERK in mProx24 cells. Western blotting analyses were performed as described in Materials and Methods. Western blotting analysis using anti-β-actin Ab confirmed that an equal amount of protein was loaded onto each lane. Representative results from six independent experiments are shown in A. LC3-II/β-actin ratios (B), p-STAT3/STAT3 ratios (C), and p-ERK/ERK ratios (D) were densitometrically determined and are shown here. All values represent means ± SEM (six independent experiments). **P < 0.01; *P < 0.05, versus mProx24 cells cultured with only NaAs. #P < 0.01; ##P < 0.05, versus untreated mProx24 cells. E: Effects of anti-IL-6 pAbs, AG490, and PD98059 on the viability of mProx24 cells cultured with NaAs for 12 hours. All values represent means ± SEM (n = 16 wells). ***P < 0.005; **P < 0.01; *P < 0.05, versus cultured with only NaAs.
Figure 3
Figure 3
A and B: RT-PCR analysis for IL-6 mRNA expression in the kidneys of wild-type mice at the indicated time intervals after NaAs challenge. Representative results from six independent experiments are shown in A. B: The ratio of IL-6 to β-actin was calculated. All values represent means ± SEM (n = 6 animals). **P < 0.01, NaAs-treated wild-type mice versus control mice. C: Immunohistochemical detection of IL-6 protein in the kidneys of wild-type mice at 10 hours after NaAs challenge. Representative results from six individual animals are shown here. At 10 hours after NaAs challenge, IL-6 protein was immunohistochemically detected in most renal tubular cells. Original magnification, ×200.
Figure 4
Figure 4
A and B: Determination of serum BUN (A) and serum CRE (B) levels in wild-type (WT) and IL-6−/− mice at the indicated time intervals after NaAs challenge. All values represent means ± SEM (n = 15). *P < 0.05; **P < 0.01, WT versus IL-6−/− mice. C–F: Histopathological observations of the kidneys from WT (C and E) and IL-6−/− mice (D and F). Representative results from six individual animals are shown here. The specimens were obtained from mice at 10 hours after NaAs challenge and were stained with H&E (C and D) or PAS staining (E and F). In IL-6−/− mice, massive tubular necrosis with cast formation and severe hemorrhages (D), and the disappearance of PAS-positive brush border were observed (F). In contrast, the histopathological changes were less evident in WT mice, compared with IL-6−/− mice (C and E). Original magnification, ×200. G: The histopathological score of the kidneys was determined as described in Materials and Methods. All values represent mean ± SEM (n = 15). *P < 0.05; **P < 0.01, WT versus IL-6−/− mice.
Figure 5
Figure 5
A and B: RT-PCR analysis for gene expression for MRP1 and MRP2 was performed at 3, 6, 10, and 24 hours after NaAs challenge, as described in the Materials and Methods. The ratios of MRP1 (A) and MRP2 (B) to β-actin were calculated and are shown here. All values represent means ± SEM (n = 6 animals). C: Intrarenal arsenic contents in wild-type and IL-6−/− mice were determined by atomic absorption spectrometry at the indicated time intervals after NaAs challenge, and the data were expressed as the arsenic amount (μg)/the kidney weight (g). All values represent means ± SEM (n = 6 animals).
Figure 6
Figure 6
The effects of BM transplantation on NaAs-induced renal injury. Recipient mice were transplanted with BM cells from IL-6−/− or wild-type (WT) donors as described in Materials and Methods. BM chimeric mice were injected with NaAs at 60 days after BM transplantation. Serum BUN (A) and serum CRE (B) levels in BM chimeric mice at 10 and 24 hours after NaAs challenge. Each value represents mean ± SEM (n = 6). *P < 0.05; **P < 0.01, WT recipient versus knockout (KO) recipient mice.
Figure 7
Figure 7
A: Immunohistochemical detection of LC3, a marker of autophagy, in the kidneys of wild-type (WT) and IL-6−/− mice after NaAs challenge. Representative results from six individual animals are shown here. At 10 hours after NaAs challenge, LC3 immunoreactivities were apparently enhanced in renal tubular cells in IL-6−/− mice, compared with wild-type mice. Original magnification, ×200. B: Western blotting analysis of the conversion of LC3-I to LC3-II, p-STAT3, STAT3, p-ERK, ERK, and β-actin in the kidney from WT and IL-6−/− mice at 6 and 10 hours after NaAs challenge. Representative results from six independent experiments are shown here. C–E: LC3-II/β-actin ratios (C), p-STAT3/STAT3 ratios (D), and p-ERK/ERK ratios (E) obtained by densitometry are shown here. All values represent means ± SEM (n = 6 animals). **P < 0.01; *P < 0.05, wild-type versus IL-6−/− mice.
Figure 8
Figure 8
Effects of exogenous IL-6 on renal injury in NaAs-treated wild-type mice. A: Determination of serum BUN levels in wild-type mice treated with IL-6 at 1 hour after NaAs challenge. All values represent means ± SEM (n = 6). *P < 0.05, IL-6 versus vehicle. B: The effects of IL-6 treatment on Erk, LC3-I, and LC3-II. Proteins were extracted from the kidney of vehicle- or IL-6-treated mice at 10 and 24 hours after NaAs challenge and were subjected to Western blotting analysis of p-ERK, ERK, LC3-I, LC3-II, and β-actin. Representative results from six independent experiments are shown here.

Similar articles

Cited by

References

    1. Oremland RS, Stolz JF. The ecology of arsenic. Science. 2003;300:939–944. - PubMed
    1. Liu J, Liu YP, Goyer RA, Chanzar W, Waalkes MP. Metallothionein-I/II null mice are more sensitive than wild-type mice to the hepatotoxic and nephrotoxic effects of oral or injected inorganic arsenicals. Toxicol Sci. 2000;55:460–467. - PubMed
    1. Kimura A, Ishida Y, Hayashi T, Wada T, Yokoyama H, Sugaya T, Mukaida N, Kondo T. Interferon-γ plays protective roles in sodium arsenite-induced renal injury by up-regulating intrarenal multidrug resistance-associated protein 1 expression. Am J Pathol. 2006;169:1118–1128. - PMC - PubMed
    1. Kimura A, Ishida Y, Wada T, Yokoyama H, Mukaida N, Kondo T. MRP-1 expression levels determine strain-specific susceptibility to sodium arsenic-induced renal injury between C57BL/6 and BALB/c mice. Toxicol Appl Pharmacol. 2005;203:53–61. - PubMed
    1. Snow E. Metal carcinogenesis: mechanistic implications. Pharmacol Ther. 1992;53:31–65. - PubMed

Publication types

MeSH terms