. 2010 Feb 18;115(7):1461-71.
doi: 10.1182/blood-2009-08-237412. Epub 2009 Dec 11.

Targeting distinct tumor-infiltrating myeloid cells by inhibiting CSF-1 receptor: combating tumor evasion of antiangiogenic therapy

Affiliations

Targeting distinct tumor-infiltrating myeloid cells by inhibiting CSF-1 receptor: combating tumor evasion of antiangiogenic therapy

Saul J Priceman et al. Blood. .

Abstract

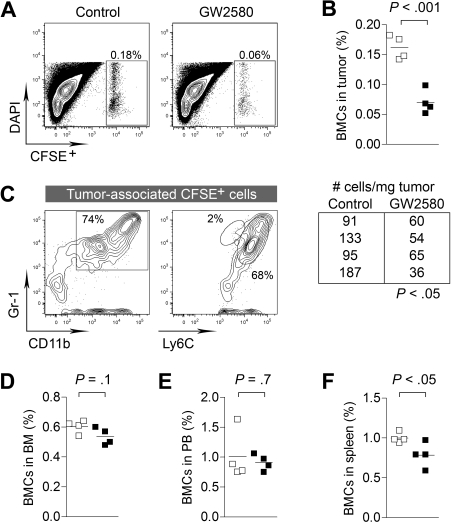
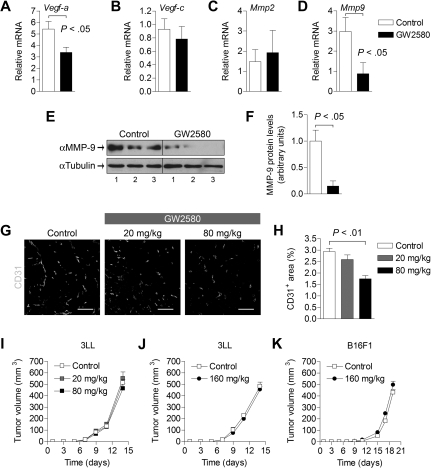
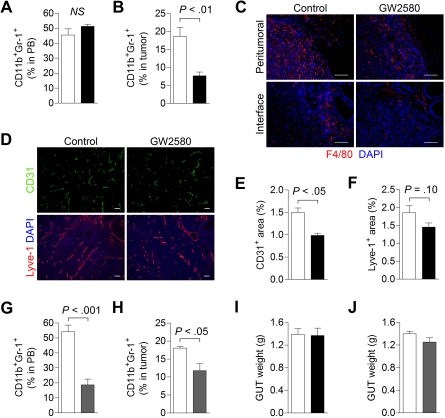
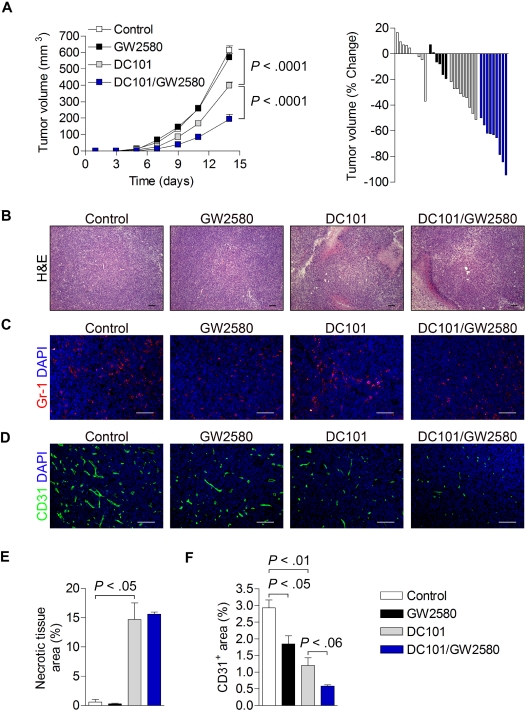
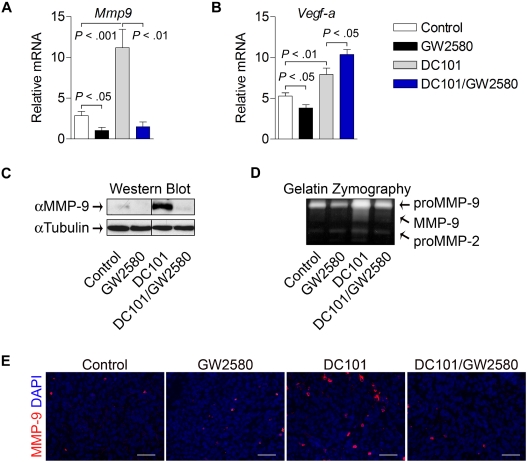
Tumor-infiltrating myeloid cells (TIMs) support tumor growth by promoting angiogenesis and suppressing antitumor immune responses. CSF-1 receptor (CSF1R) signaling is important for the recruitment of CD11b(+)F4/80(+) tumor-associated macrophages (TAMs) and contributes to myeloid cell-mediated angiogenesis. However, the impact of the CSF1R signaling pathway on other TIM subsets, including CD11b(+)Gr-1(+) myeloid-derived suppressor cells (MDSCs), is unknown. Tumor-infiltrating MDSCs have also been shown to contribute to tumor angiogenesis and have recently been implicated in tumor resistance to antiangiogenic therapy, yet their precise involvement in these processes is not well understood. Here, we use the selective pharmacologic inhibitor of CSF1R signaling, GW2580, to demonstrate that CSF-1 regulates the tumor recruitment of CD11b(+)Gr-1(lo)Ly6C(hi) mononuclear MDSCs. Targeting these TIM subsets inhibits tumor angiogenesis associated with reduced expression of proangiogenic and immunosuppressive genes. Combination therapy using GW2580 with an anti-VEGFR-2 antibody synergistically suppresses tumor growth and severely impairs tumor angiogenesis along with reverting at least one TIM-mediated antiangiogenic compensatory mechanism involving MMP-9. These data highlight the importance of CSF1R signaling in the recruitment and function of distinct TIM subsets, including MDSCs, and validate the benefits of targeting CSF1R signaling in combination with antiangiogenic drugs for the treatment of solid cancers.


Figures

Figure 1
Figure 1
Inhibiting CSF1R signaling in macrophages with the pharmacologic inhibitor GW2580. (A) Immunoprecipitation and Western blot analysis of Raw264.7 murine macrophage cells stimulated with 10 ng/mL CSF-1 for 20 minutes in the absence or presence of 10, 100, or 1000nM GW2580. Blot was probed for tyrosine phosphorylation (pTyr), stripped, and reprobed for total CSF1R. (B) BMDMs were stimulated with CSF-1 in the absence (□) or presence of 10nM (▵), 100nM (◇), or 1000nM (○) GW2580. At the indicated time points, cell viability was measured using the CCK-8 assay and compared with unstimulated control. (C) BMDMs were seeded on 8-μm transwell inserts, and CSF-1 was added to the lower chamber in the absence or presence of 1000nM GW2580 (added to both chambers). Cells were allowed to migrate toward CSF-1 for 6 hours and then fixed and stained with DAPI. Representative images are shown and migrated cells were quantified using ImageJ software (□, control, no CSF-1; formula image
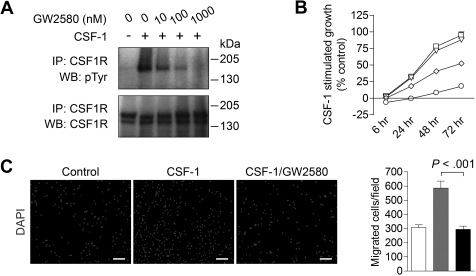
, CSF-1; ■, CSF-1/GW2580). Scale bar represents 100 μm.
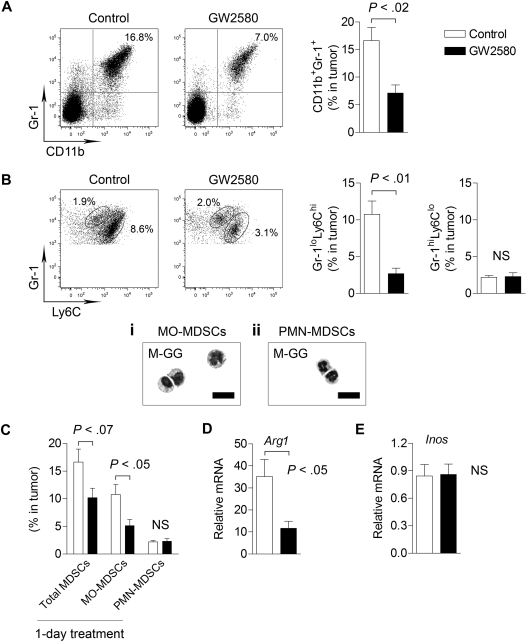
Figure 2
Figure 2
Targeting MO-MDSC infiltration by inhibiting CSF1R signaling. 3LL tumor cells were subcutaneously implanted in C57BL/6 mice, and mice were treated with control diluent or 160 mg/kg GW2580 once daily. At day 14, single-cell suspensions of tumors were analyzed by flow cytometry. Representative images and quantification of total CD11b+Gr-1+ MDSCs (A), Gr-1loLy6Chi MO-MDSCs and Gr-1hiLy6Clo PMN-MDSCs (B) are shown (n = 4/group). May-Grunwald-Giemsa staining of sorted MDSC populations within the tumor (Bi-ii). (C) Mice were implanted with 3LL tumors and treated with GW2580 once 24 hours before harvesting tumors for flow cytometric analysis. Total MDSCs, MO-MDSCs, and PMN-MDSCs were quantified (n = 3-4/group). RT-PCR analysis of Arg1 (D) and Inos (E) expression in tumors from control and GW2580-treated mice. Relative mRNA expression was normalized to β-actin (n = 6/group). Scale bars represent 50 um.
Figure 3
Figure 3
CSF1R signaling regulates tumor recruitment of myeloid cells from peripheral blood. 3LL tumor-bearing mice (day 10 after implantation) were treated with control diluent or GW2580 (for 4 hours) and subsequently intravenously injected with 20 × 106 CFSE-labeled BMCs. After 4 hours, animals were killed and tissues were analyzed for recruitment of CSFE+ BMCs by flow cytometry. (A-B) Percentage of CFSE+ BMCs in tumor and absolute number of cells/mg tumor are shown (n = 4/group). (C) The majority of tumor-recruited CFSE+ cells were CD11b+Gr-1+ and Ly6Chi. (D-F) Percentage of CFSE+ BMCs in the bone marrow, peripheral blood, and spleens are shown (n = 4/group).
Figure 4
Figure 4
Angiogenesis and growth kinetics of tumors treated with GW2580. (A-D) Tumors were harvested on day 14 after tumor implantation and GW2580 treatment, and mRNA expression was quantified using RT-PCR for the stated genes. Relative mRNA expression was normalized to β-actin (n = 6/group). (E) MMP-9 protein levels from tumors were analyzed by Western blot and normalized to α-tubulin. (F) Quantification of MMP-9 protein levels by ImageJ software (n = 3/group). (G) Representative CD31+ vascular staining of 3LL tumors from control and GW2580-treated mice is shown. (H) Quantification of CD31+ area was performed using ImageJ software (n ≥ 5/group). Tumor volume was monitored by caliper measurements of 3LL tumors (I-J; n = 6/group) and B16F1 tumors (K; n = 3/group) in mice treated with control diluent, 20 mg/kg, or 80 mg/kg GW2580 twice a day, or 160 mg/kg GW2580 once daily. Scale bars represent 100 μm.
Figure 5
Figure 5
Targeting MDSC infiltration and tumor angiogenesis in orthotopic RM-1 prostate tumors. RM-1 prostate tumor cells were implanted intraprostatically in the dorsolateral lobes of C57BL/6 males. Mice were treated with control diluent, GW2580, PBS, or clodronate liposomes (Clodrolip) at the appropriate dosing regimen. (A) Peripheral blood (n = 5/group) total MDSCs were analyzed by flow cytometry in control (white bar) and GW2580-treated (black bar) mice. (B) Tumor-associated MDSC levels (n = 3-5/group) were also analyzed by flow cytometry in control and GW580-treated mice. (C) Tumor tissue was processed and subjected to histologic staining of F4/80+ TAMs at the peritumoral regions (top) and normal prostate-tumor interface (bottom). (D) Representative CD31+ blood and Lyve-1+ lymphatic vascular staining of RM-1 prostate tumors from control and GW2580-treated mice are shown. Quantification of CD31+ (E) and Lyve-1+ (F) area was performed using ImageJ software (n = 3-5/group). (G-H) Peripheral blood (n = 5/group) and tumor-associated MDSC (n = 3 or 4/group) levels were analyzed by flow cytometry in PBS- (white bar) and Clodrolip-treated (gray bar) mice. Genitourinary tract (GUT) weight was measured at endpoint in GW2580-treated (I) and Clodrolip-treated (J) mice (n = 3-5/group). Scale bars represent 100 μm.
Figure 6
Figure 6
Synergistic tumor growth reduction and inhibition of angiogenesis by combination therapy with GW2580 and anti–VEGFR-2 antibody DC101. 3LL tumors were subcutaneously implanted and mice were treated with control diluent, GW2580 or DC101 alone, or a combination of DC101/GW2580 for 14 days. (A) Tumor volume was monitored by caliper measurements. Tumor volume is presented as the average tumor volume (mm3) per group over time and as a waterfall plot of tumor volume (% change) of each animal per group at day 14 (n = 5-9/group). At day 14, tumors were harvested and subjected to histologic analysis of hematoxylin and eosin (B), Gr-1+ MDSCs with DAPI (C), and CD31+ vessels with DAPI (D). Necrotic tissue area (E) and CD31+ area (F) were quantified using ImageJ software (n ≥ 5/group). Data represent combined averages from 2 independent animal experiments. Scale bars represent 100 μm.
Figure 7
Figure 7
TIMs mediate MMP-9 induction by anti–VEGFR-2 therapy. Tumors were harvested at day 14, and mRNA expression was quantified using RT-PCR for Mmp9 (A) and Vegf-a (B). Relative mRNA expression was normalized to β-actin (n ≥ 5/group). (C) MMP-9 protein levels from tumors were analyzed by Western blot and normalized to α-tubulin (n = 6/group). Representative images are shown. (D) The same tumor lysates were analyzed by gelatin zymography (n = 6/group). Representative images are shown. Tumor tissue was subjected to histologic analysis of MMP-9 expression with DAPI (E). Scale bars represent 50 μm.

References

    1. Murdoch C, Muthana M, Coffelt SB, et al. The role of myeloid cells in the promotion of tumour angiogenesis. Nat Rev Cancer. 2008;8(8):618–631. - PubMed
    1. Lewis CE, Pollard JW. Distinct role of macrophages in different tumor microenvironments. Cancer Res. 2006;66(2):605–612. - PubMed
    1. Gordon S. Alternative activation of macrophages. Nat Rev Immunol. 2003;3(1):23–35. - PubMed
    1. Gabrilovich DI, Nagaraj S. Myeloid-derived suppressor cells as regulators of the immune system. Nat Rev Immunol. 2009;9(3):162–174. - PMC - PubMed
    1. Sawanobori Y, Ueha S, Kurachi M, et al. Chemokine-mediated rapid turnover of myeloid-derived suppressor cells in tumor-bearing mice. Blood. 2008;111(12):5457–5466. - PubMed

Publication types

MeSH terms

Substances